Disease management apps allow users to make informed decisions in the field.
Apps that can be used at any time and in any place to run decision-making scenarios based on the latest knowledge and data are increasingly becoming standard farm tools.
They are proving to be particularly useful for crop disease management, which can be complex and risky. Loss to disease depends on past and future weather, crop variety characteristics, location of infection sources, crop growth stage, potential yield, availability and effectiveness of fungicides and several other factors.
Also, the economics of different management options depends on the cost of those options and grain prices. Compounding this, every paddock and every season is different, outcomes are uncertain at the time when management decisions are being made and a wrong decision can prove costly.
Growers and agronomists know they need to keep their knowledge of disease management up to date but finding and compiling all the latest relevant information is a challenge – and this is where apps are proving invaluable.
App development
The Western Australian Department of Primary Industries and Regional Development, Agriculture Victoria and the NSW Department of Primary Industries have assembled all the important information for key crop diseases in Australia into several easy-to-use apps for tablet devices.
This GRDC-invested project compiled historical disease research results and undertook additional epidemiological research where disease risks were uncertain. In collaboration with Australia’s leading pathologists and epidemiologists, the drivers of disease risk were identified and used to develop a suite of decision tools that can be used in the field or wherever management decisions are being made.
The most recent tool is the StripeRustWM app for wheat, available from the Apple App Store for iPads or Google Play for Android tablets.
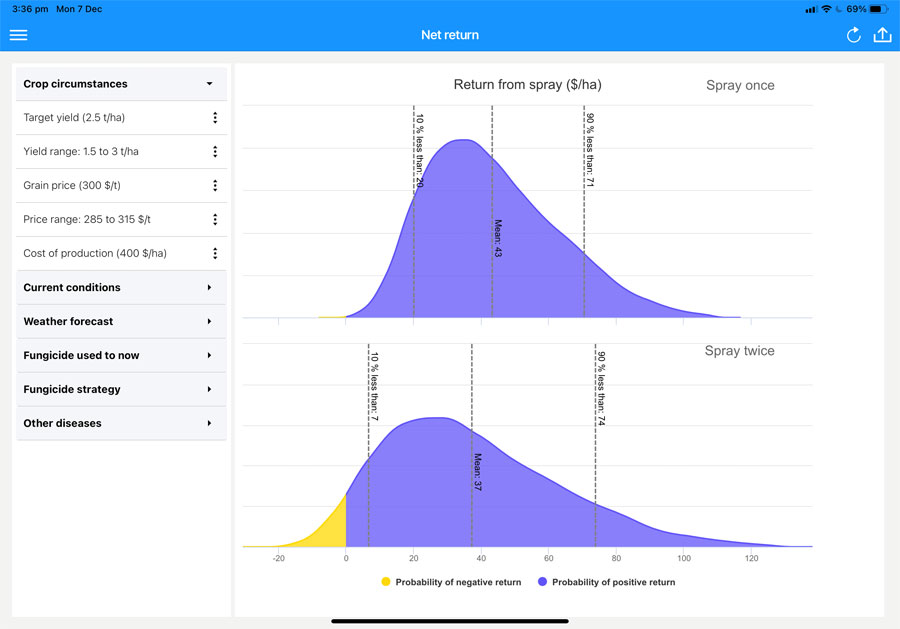
StripeRustWM estimates the value of either one or two applications of fungicide compared to not applying fungicide. The value of applying fungicide is presented as the range of likely net returns that will result from applying fungicide – namely minimum, mean and maximum net return in dollars per hectare. The user can choose to see the results either as a table or a graph (Figure 1).
Figure 1: The distributions of expected net return from StripeRustWM for an example situation showing that a single application of fungicide is likely to have a higher net return than two applications, and that there is a wider range of expected net returns for two applications, including an increased chance of losing money.

Source: Dr Art Diggle
Once downloaded, StripeRustWM can be used anywhere, even without a network connection.
The results from StripeRustWM are tailored for the individual conditions of each paddock based on straightforward user inputs:
- target yield (as a range of lowest, most likely and highest);
- expected grain price (lowest, most likely and highest);
- the stripe rust resistance rating of the variety;
- the crop’s growth stage;
- the disease level found in the crop or in the district;
- forecast rain in the next two weeks;
- details of any fungicide that has already been applied;
- timing of planned fungicide applications; and
- expected loss from any other diseases that might be present.
Use patterns
Since its launch in February 2020, StripeRustWM has been used more than 800 times by more than 200 users. While it cannot be determined who was using the app, or where it was used, researchers do know when it was used.
The main period of use was from late July to October, peaking in August. This pattern coincided with the appearance of stripe rust in wheat crops in 2020 and indicates that StripeRustWM is helping to satisfy a substantial demand for help in identifying the best management option.
The overall usage counts provide valuable information that will help with future development.
A new app, YellowSpotWM for management of yellow spot in wheat, is scheduled for release in 2021.
More information: Dr Art Diggle, 08 9368 3563, art.diggle@dpird.wa.gov.au
The following disease management apps can be downloaded via the Apple App Store for iPads or Google Play for Android tablets:
- StripeRustWM for stripe rust in wheat;
- BlacklegCM for blackleg stem canker in canola;
- SclerotiniaCM for Sclerotinia stem rot in canola; and
- PowderyMildewMBM for powdery mildew in mungbean.


