


Key points
- A soil’s ‘bucket size’ – or plant-available water capacity (PAWC) – plays a crucial role in determining potential yield
- PAWC is determined by crop and soil factors
- Soil properties change within the landscape and relate to landscape position and the origin of soil materials
- Researchers are working to correlate soil-landscape data to PAWC
Researchers are working to correlate readily available soil and landscape information to a soil’s ‘bucket size’, potentially helping to inform cropping and management decisions.
A soil’s ‘bucket size’ – or plant-available water capacity (PAWC) – plays a crucial role in determining potential yield. Over the past 20 years, CSIRO in collaboration with state agencies, catchment management organisations, consultants and growers has characterised more than 1000 sites around Australia for PAWC.
The project leader, CSIRO researcher Dr Kirsten Verburg, says PAWC is determined by crop factors – such as rooting depth and duration – and soil factors including texture, structure and subsoil constraints.
The soil properties that affect PAWC change within the landscape and relate to landscape position and the origin of soil materials.
“These aspects are reflected in soil-landscape models that underpin soil survey maps, which have been produced by state government departments and other research organisations,” Dr Verburg says.
Likewise, CSIRO’s PAWC characterisations are available online in the APSoil database, which provides geo-referenced data for points in the landscape. Although growers and advisers can find a similar soil in the APSoil database, when there is no characterisation available for their paddock, it becomes challenging. This is because a local PAWC characterisation is needed. “And what do you do when you are not in a position to do that? Our project is testing the hypothesis that soil-landscape information can inform PAWC prediction,” Dr Verburg says.
Research
As part of the research, the team had already characterised areas of the Liverpool Plains, NSW, and knew soils and PAWC could vary over short distances.
For example, in an area near Gunnedah, NSW, one APSoil site has a PAWC of 116 millimetres, while, not far away, another has a PAWC of 253mm.
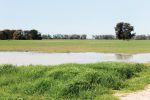
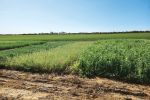
Figure 1: PAWC at different points in the landscape.

In an area near Gunnedah, APSoil site 1171 (a) has a PAWC of 253mm, yet not far away, APSoil site 1170 (b) has a PAWC of 116mm. These sites relate to the areas marked on the map in Figure 2. Source: CSIRO
Figure 2: Google Earth image showing PAWC points on the Liverpool Plains
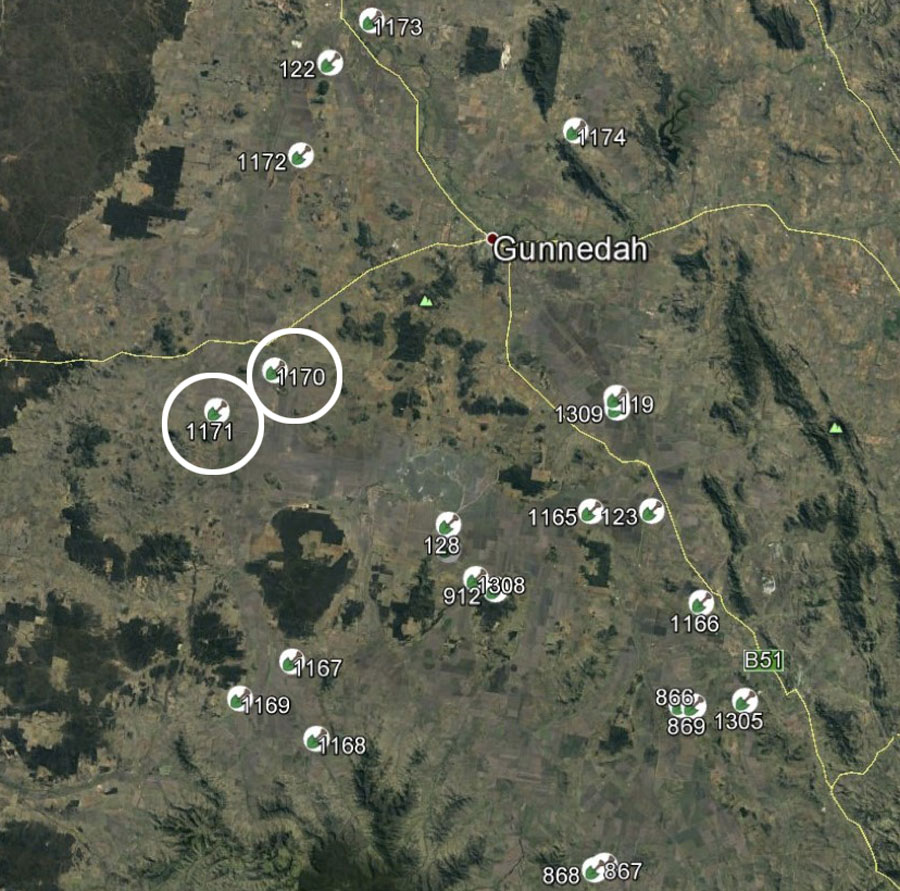
In Google Earth, the APSoil characterisation sites are marked by a shovel symbol and have information about the PAWC profile. Source: CSIRO
This means growers and advisers cannot reliably use information from an APSoil site geographically closest to their paddocks and assume soils will be similar.
Yet, a wealth of existing soil-landscape data is available. It made the research team wonder if that data could be used that to make PAWC predictions.
The concept is based on previous work that provided soil management advice specific to soil-landscape positions. It was used in the Glovebox guide to soil of the Macquarie–Bogan flood plain by Hulme (2003) – land management manuals available for several regions in Queensland – and the online mapping and reports for soil-landscapes and soil and land resources in various regions of NSW.
This information is increasingly available online. In Queensland, the maps can be accessed via the Queensland Globe, while in NSW the maps are available via the eSPADE tool.
“What these resources have in common is that they draw on the mapping of ‘soil-landscape units’ or ‘land resource areas’ that identify broad landscape units. These units group together soils developed from related geology and exhibit recurring patterns of topography and vegetation,” Dr Verburg says.
“So, this existing soil-landscape information provides an opportunity to predict PAWC and other soil properties where measured data are not available.”
In this example, researchers used Macquarie–Bogan flood plain landscape data.
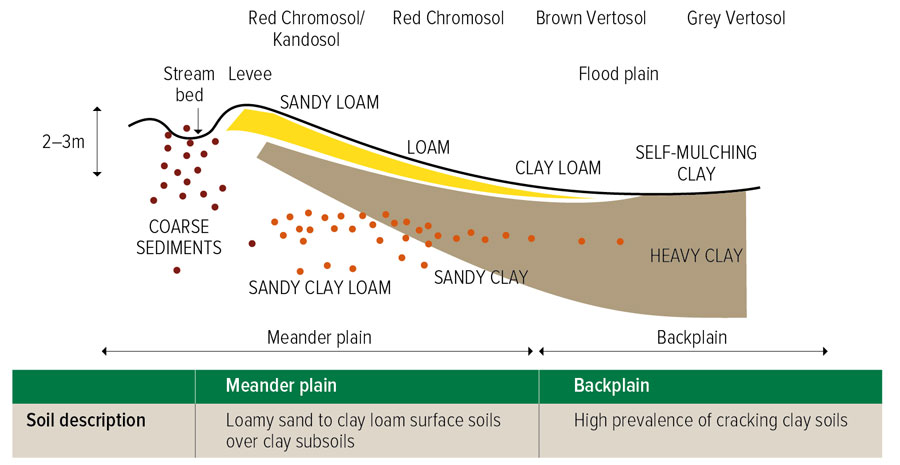
Figure 3: Macquarie-Bogan flood plain example
Source: CSIRO
Figure 3 shows a landscape overview of the Macquarie–Bogan flood plain, differentiating between the soils of the meander plain, where the waterway ‘meandered’, and the backplain, which resulted from the deposition of material by a river, stream, or current. Adapted from a diagram first developed by Bruce Butler in 1958.
Its soil properties are determined by the soil’s parent material, development and position in the landscape, and are broadly broken into two categories – the meander plains and the backplains.
Characterising the soils, the researchers found the backplain soils had a PAWC of about 200mm, while the meander plain soils had a more variable PAWC, depending on soil texture.
Table 1: Select APSoil characterisations in Macquarie–Bogan flood plain region with PAWC (to 180cm or rooting depth)
")
Source: CSIRO.
The team has also worked on predicting PAWC from data included in digital soil maps such as the Soil and Landscape Grid of Australia. These maps provide information on soil properties on a grid and are themselves predictions. They are based on spatial models that incorporate information on soil forming factors such as parent material, climate, terrain and vegetation.
In theory, Dr Verburg says, the process is working: the team can use existing soil and landscape data to predict PAWC.
Although mixing and matching the information from available resources is a challenge, Dr Verburg hopes the research will work its way around this. “The current project is not only testing and refining the PAWC prediction processes, but also looking at how to make them more user-friendly.”
That could include finding a paddock’s landscape resource, determining its soil types, corroborating that with information from a digital soil map, matching that information to the APSoil database, and then adjusting PAWC to local conditions.
This is being tested for a number of paddocks in six case study areas – the Liverpool Plains, Macquarie–Bogan flood plain, Northern Moree Plains and the Young–Harden hills in NSW, and the Central Darling Downs and Central Highlands in Queensland.

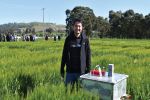
The CSIRO team, with Tony Nadelko (left) and Brett Cocks (right), taking soil cores and describing the landscape in the Central West NSW case study. Photo: Kirsten Verburg
“In the meantime, our advice is to explore some of the available information and maybe seek out soil experts who understand how soils vary across the landscape. In some regions, there are soil and land resource officers in state agencies who have the detailed knowledge that can help,” she says.
“The accumulated knowledge on yield trends and paddock differences, from yield mapping or farm records, can also be used to understand the inherent qualities of the soils, including PAWC.
“Under water-limited growing conditions, paddocks or areas within them with subdued yields may indicate PAWC constraining factors. These observations can be used to target further investigations, including into the presence of texture changes, subsoil salinity or other factors like shallow soil depth.”
What is PAW?
Plant-available water (PAW) is the volume of water stored within the soil available to the plant at a point in time. It is the difference between current soil water and crop lower limit (CLL), which is the amount of water remaining after a particular crop has extracted all the water available to it from the soil.
PAW is a key determinant of potential yield in dryland agriculture. In the northern region its contribution to productivity for both winter and summer cropping has long been recognised. It influences decisions to plant or wait, to sow earlier or later, and input levels.
Estimating PAW, whether through soil coring, use of a soil water monitoring device or a push probe, also requires knowledge of the soil’s plant-available water capacity (PAWC).
What is PAWC?
PAWC is the difference between the drained upper limit (DUL), the amount of water a soil can hold against gravity, and the CLL.
To characterise a soil’s PAWC, these factors, plus bulk density (BD), need to be determined.
In addition, subsoil constraints such as salinity, sodicity and acidity – which may have affected a soil’s ability to store water or the plant’s ability to extract water from the soil, such as rooting depth – need to be considered.
“Essentially, once you know the size of the soil’s bucket (PAWC), then PAW is the amount of water that is in the bucket and available to the crop,” CSIRO researcher Dr Kirsten Verburg says.
The field measurement of DUL, CLL and BD are described in detail in the GRDC PAWC booklet Estimating plant-available water capacity.
Figure 4: What is PAW?

Source: CSIRO
Figure 5: What is PAWC?

Source: CSIRO
Where to find existing information
PAWC characterisations for more than 1200 soils across Australia have been collated in the APSoil database and are freely available to growers, advisers and researchers. The database software and data can be downloaded from the APSIM website.
The characterisations can also be accessed via Google Earth (KML file from APSoil website) and in the SoilMapp application.
In Google Earth, the APSoil characterisation sites are marked by a shovel symbol, with information about the PAWC profile appearing in a pop-up box if one clicks on the site.
In SoilMapp, the APSoil sites are represented by green dots. Tapping on the map results in a pop-up that allows one to ‘discover’ nearby APSoil sites or other soil (survey) characterisations.
More information: Kirsten Verburg, 02 6246 5954, kirsten.verburg@csiro.au