


To support growers in making more-informed machinery investment decisions, in 2020 GRDC invested in a two-year project spanning the breadth of grower experiences across the nation. The snapshot of machinery investment information from more than 450 growers has been used to hone a more-accurate benchmark to compare growers’ investment strategies to those in similar environments and with similar businesses.
Kondinin Group’s Ben White led the study, with input from farm business consultants Farmanco, Pinion Advisory and AgriPath working together with Primary Business and CussonsMedia.
“The guide serves to identify machinery investment benchmarks that could help growers where they are not using a farm business adviser,” Mr White says.
“Previous benchmarks have been based on fewer parameters, most notably lacking labour and maintenance inputs. These have included total investment in machinery versus either gross farm income or cropped area.”
Farm business advisers are used more frequently by growers in the western region than in the southern and northern regions. Advisers regularly use benchmarks to compare business performance which are excellent tools when it comes to independent expertise for decision-making.
The power in this new guide and benchmark is that it has used a national dataset and this reinforces the value of these benchmarks for western growers and provides useful data for growers in the northern and southern regions without access to an adviser.
Benchmark
The new benchmark has been coined the ‘Machinery Investment Ratio’ formula. It requires growers to calculate their total plant (TP), labour (L), maintenance (M) and contracting costs (C) relative to their total gross farm income. This ratio indicates the efficiency of owning and operating machinery.
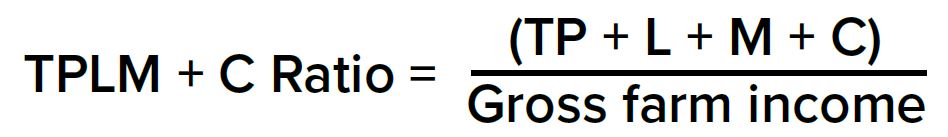
Machinery Investment Ratio
The spread in the ratio across Australia is shown in Figure 1, with an average ratio of national machinery investment of 34 cents in every dollar of farm income generated (a machinery investment ratio of 0.34). While this ratio can vary regionally, businesses that have a ratio of less than 0.34 are typically more efficient with their machinery investments. Ratios greater than 0.4 indicate lower efficiencies.
Figure 1: Ratio of total plant labour, maintenance and contracting to total gross farm income (Sample=411).
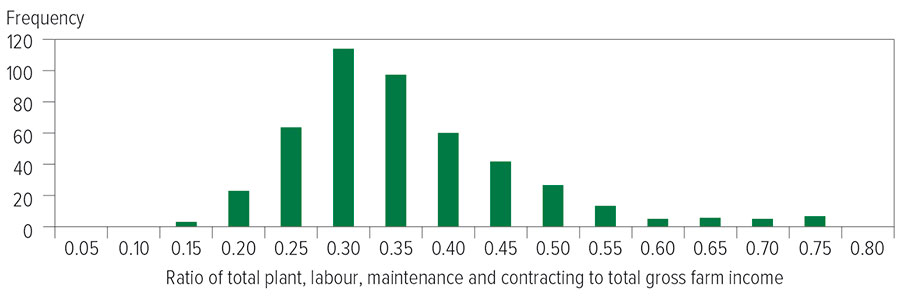
Source: Kondinin Group, 2020
“Benchmarking data provides growers with a critical starting point to compare their own machinery investment strategies with peers and could help determine whether they are over or underspending in comparison to industry averages and point to ways of improving efficiencies,” Mr White says.
Mr White says growers can work through various business scenarios using this benchmark. For example, if they consider dropping a labour unit, they might need to increase total plant investment to maintain the optimum ratio of 0.34 for efficiency.
“They can then analyse their own machinery utilisation, fleet management practices, repair and maintenance costs, and labour levels to better manage their investment in machinery.”
Figure 2 shows the relationship between total plant, maintenance, labour and contracting costs versus gross farm income for the growers in the study from northern, southern and western regions. This illustrates the spread of regional variances for the ratio. The western region had the lowest average ratio of TPLM+C to gross farm income of about 0.32, while the southern and northern regions had average ratios of 0.38 and 0.35 respectively.
Figure 2: Total plant, maintenance, labour and contracting costs versus gross farm income across the northern, southern and western regions.
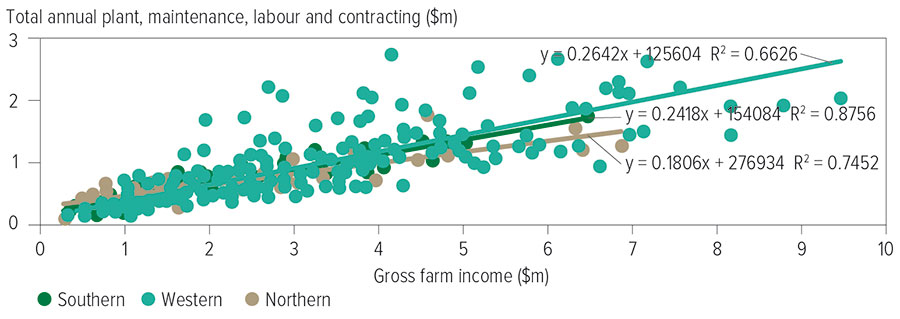
Source: Kondinin Group, 2020
Resources
Integral to the project are in-depth case studies. Owners of 30 grain businesses from across Australia were interviewed to compile machinery inventories, likely drivers for change or trade and individual philosophy and approach to machinery investment.
Table 1: Drivers of machinery replacement.
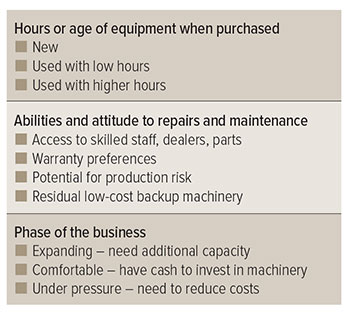
Source: Kondinin Group
These drivers of change are summarised in Table 1 and are influenced by debt repayment, seasonal conditions, grain prices and expansion plans. Their attitude to business risk is captured in the phase of development of the business.
“Machinery selection and turnover is usually governed by machine hours or area covered. Older machinery can require increased repair and maintenance regimes, but costs less to operate on a per-hectare basis. New machinery is often built using modular componentry and repairs may be more costly as entire modules may need to be replaced,” Mr White says.
“This suite of case studies illustrates that there is no ‘one-size-fits-all’ strategy and growers need to determine the levels of machinery investment or a contracting approach that’s suitable for their farm business.
“The case studies provide useful comparators for growers to assess their machinery investment strategies to similar businesses in similar environments.”
The guide also contains a decision support tool from Farmanco that provides a framework for growers to use when making machinery and technology investments on-farm, together with two examples.
Additionally, the guide encourages growers to maintain an up-to-date machinery value inventory (see Table 2 for an example).
Sample case study reproduced from the guide
Summary
Gavin and Hayley Hill, Holt Rock
Location: Holt Rock, Western Australia
Rainfall: 320 millimetres (210mm growing season)
Soil types: 65 per cent heavy (loam), 35 per cent light (yellow gravel sand)
Cropping area: 6330 hectares
Crops: Wheat, barley, canola, lupins, field peas, oaten hay
Average wheat yield: 1.8 tonnes/ha (five-year average)
Permanent labour units: 1 to 2
Seasonal staff: 2 for seeding, 5 for harvest and hay work
Total machinery investment: $340/cropped hectare
Annual machinery replacement investment: About $300,000

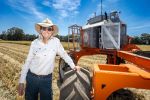
Gavin and Haley Hill, Holt Rock. Photo: Haley Hill
Holt Rock growers Gavin and Hayley Hill say the key to making machinery investment work well for them is to carefully consider all options and avoid having to make rushed decisions. For the Hills, this includes working the numbers carefully to understand the return on investment. Buying well is important in keeping the depreciation cost down, particularly for higher-value gear such as harvesters.
Being relatively remote means a call-out to the farm costs $600 before a spanner is even lifted, so most repairs and maintenance are done on-farm by themselves. While Gavin and his team do not have formal mechanical qualifications, boilermaker experience and sound practical knowledge go a long way to being able to address any breakdowns.
Major annual maintenance requirements are also done by Gavin and his team on-farm. As an example, harvesters undergo a post-harvest evaluation and recommendations for remedial repairs, with a parts list provided by their local John Deere dealer.
The ability to repair and maintain gear also influences changeover timing, with Gavin able to keep older gear going until an opportunity arises. He says the weekly rural papers and auction results are an important pricing touchstone and he studies them regularly.
Both new and low-hour second-hand equipment is purchased, with calculations done on the depreciation cost of used equipment. The weekly rural papers are again used to identify equipment options when it is time to purchase. Gavin says both family and staff are involved in selecting the gear, with a practical maintenance perspective coming from staff helping to identify the best machine for the job.
From a financing perspective, manufacturer-provided (Agco and John Deere) chattel mortgage finance for both new and used equipment has proved to offer very competitive rates.
Table 2: The Hills’ machinery inventory, including hours of usage, repairs and maintenance and replacement trigger.
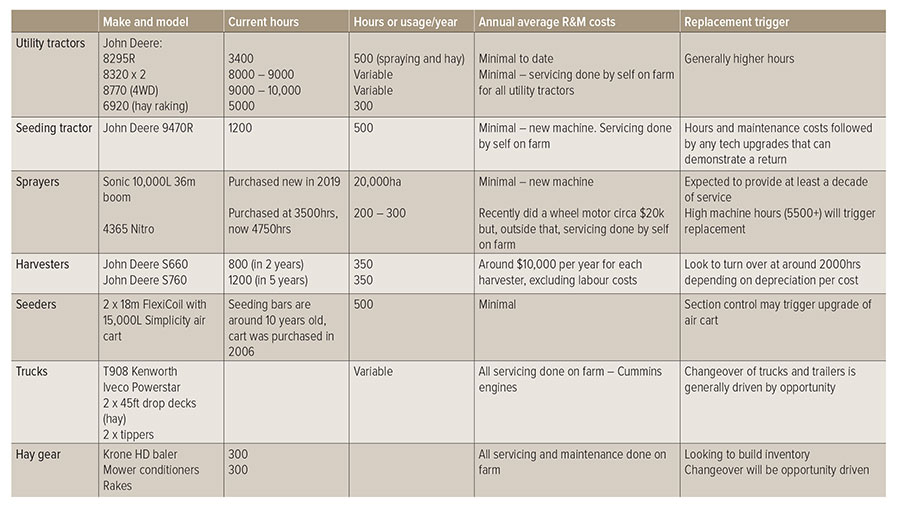
Source: Kondinin Group
With export hay comprising a significant part of their cropping program, Gavin says surplus cash in the business is currently funnelled into internal expansion of that component of the operation.
Hay-specific machinery purchases, including Krone high-density balers, has seen a shift from contractors to their own hay gear. With contract baling costing $32/tonne and the baler capable of producing 80 700-kilogram bales per hour, the cost of the baler is quickly recouped.
Gavin and Hayley run their operation on a nine-metre controlled-traffic regime, employing two 18m Flexi-Coil 820 bars which are paired with a 15,000-litre Simplicity cart.
Gavin explains that one bar is set up with 229-millimetre (9-inch) spacing for hay, while all other crops are planted with the other machine on 305mm (12”) spacing.
The seeding rigs are pulled by the latest purchase in their fleet, a John Deere 9470R, which was bought new in 2018.
Spraying equipment has been most recently upgraded with a 10,000L, 36m Sonic boomspray with Airtec twin-fluid system that does the bulk of the spray work. It is supplemented with a 4365 Miller Nitro self-propelled sprayer for busy requirement times, in-crop and summer spraying work.
Gavin explains that utility tractors are plentiful on-farm, with the requirement for hay work taking up to five machines in one paddock for baling and stacking. These tractors usually clock long hours (8000 to 10,000 hours is not uncommon) with newer low-hour utility tractors purchased shuffling others down the inventory list.
He says he does not like old gear lying around the farm so at some stage it is moved on if an opportunity arises, but with hay and field bin duties calling, there is nearly always an application for the older iron at the Hill operation.
Printed copies of the guide are available from Groundcover Direct and digital copies are available from the GRDC website.
More information: Ben White, 0407 941 923, ben@kondinin.com.au