


Key Points
- Maps of yield gaps due to soil constraints are guiding research investment into these constraints
- Sodicity has a greater impact on yield gaps than acidity and salinity

University of Queensland researcher Dr Tom Orton. Photo: Dr Tom Orton
Soil constraints are one of several causes of yield gaps in Australia and their nature and extent need to be identified to enable more effective amelioration or management.
To quantify the impact of different soil constraints on wheat yields across Australia, GRDC invested in an audit of the constraints with researchers at the University of Queensland, the Queensland Government and CSIRO in 2015.
The intention was to gain the information needed to guide future GRDC soil constraint investments.
The project was undertaken by a multidisciplinary research team, which included specialists in remote sensing, soil science, mapping and economics.
Dr Tom Orton of the University of Queensland undertook the mapping work, bringing to the task foundational training as a mathematician and experience in analysing soil datasets from the UK and France.
"In particular, I look at methods for integrating data of different quality - perhaps some data with very small errors and others with larger errors but which still contribute useful information," Dr Orton says.
This was essential for the project as datasets from different sources and across states had to be combined.
Soil Constraints
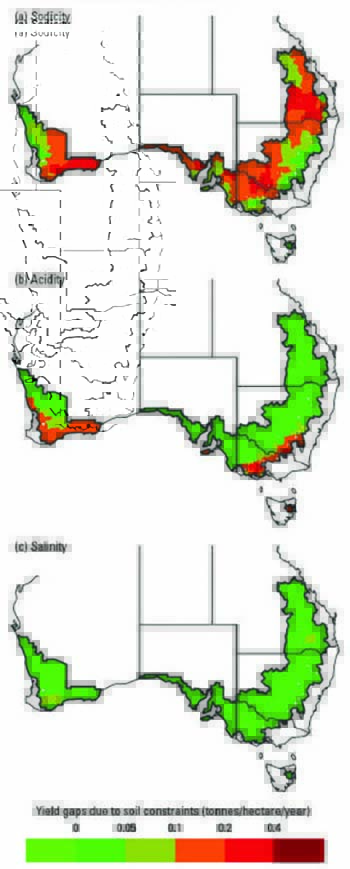
Figure 1: Gross economic value of yield gaps due to (a) sodicity, (b) acidity and (c) salinity at statistical area level 2. Source: Orton et al. 2018*
"The aim of this project was to summarise the impacts of major soil constraints at broad spatial scales, rather than at paddock scale," Dr Orton says.
The work focused on four soil constraints: sodicity, acidity, salinity and compaction. Limitations in the quality of data meant compaction estimates were more uncertain than those for the other constraints.
A multi-step process was applied to each constraint.
First, a mathematical function predicting wheat yields in response to climate and soil was developed and applied at locations where soil profile data (from the National Soil Site Collation database) was available.
This comprised data from each soil profile as it had actually been measured, and then with the soil constraint in each profile ameliorated.
The difference between these two predicted yields was the yield gap due to the soil constraint at the data locations.
Next, a digital soil mapping approach was applied to predict these yield gaps on a one-kilometre grid across wheat growing areas.
The predictions were aggregated to statistical area level 2 (which in the wheat regions vary in area from less than 2000 hectares to more than 5,000,000ha) for reporting results to GRDC.
Finally, economic analyses were undertaken with these yield gaps as input data and are shown in Figure 1.
Wheat Yield Gaps
Of the soil constraints examined, sodicity caused the largest yield gaps across most of Australia's wheat cropping areas, with an average yield gap of 0.13 tonnes/hectare/year.
Soil sodicity is due to an excess of sodium ions in relation to other cations and leads to soil dispersion, poor soil structure, low water infiltration, susceptibility to erosion and nutrient imbalances, all of which affect plant growth.
Yield gaps due to acidity were more concentrated spatially in the high-rainfall regions of Western Australia, Victoria and New South Wales, averaging 0.04t/ha/year. The yield gap due to salinity was estimated to be 0.02t/ha/year.
The lost opportunity associated with soil sodicity for wheat production was estimated to be $1.3 billion/year, soil acidity $400 million/year and salinity $200 million/year.
"Possibly the most surprising result was that the yield gaps due to acidity were not larger, particularly in WA, where we estimated yield gaps of about $300 million/year for acidity and more than $500 million/year for sodicity," Dr Orton says.
This could be partly due to acidity issues already being managed more effectively than sodicity.
The analysis did not take into account soil acidification through farming over time; rather, it used the soil data as a snapshot of soil constraints.
A further factor is that the relative acid tolerance of wheat, compared with other crops, reduced the gap due to acidity.
Possibly the most surprising result was that the yield gaps due to acidity were not larger, particularly in WA.
- University of Queensland researcher Dr Tom Orton
Wheat was used in this study because of the availability of data for wheat yields, but this may not be representative of yield gaps for other crops.
Project outcomes have already proven insightful to guide GRDC investment in soil amelioration, and have also been beneficial in raising growers' awareness of potential profitability gains from soil amelioration.
More information: Dr Tom Orton, t.orton@uq.edu.au
* Orton TG, Mallawaarachchi T, Pringle MJ, Menzies NW, Dalal RC, Kopittke PM, Searle R, Hochman Z, Dang YP, 2018. Quantifying the economic impact of soil constraints on Australian agriculture: a case study of wheat. Land Degradation and Development 29, 3866-3875.