


Snapshot
Location: Thuddungra, New South Wales
Farm area: 4800 hectares
Area cropped: 3700ha
Average annual rainfall: 600 millimetres (long term); 550mm (2020)
Soil types: sandy clay loam
Topography: undulating
Soil pH range: 4.6 to 6.0 (calcium chloride)
Enterprises: cropping and sheep
Crops grown: wheat and canola
Typical crop sequence: wheat/canola/wheat/canola/wheat/canola/wheat/lucerne/lucerne/lucerne
Broden Holland and his family are using grain protein data from their wheat crops to guide urea application rates and lift yields.
“The use of protein data to guide our nitrogen application rates has helped lift our average yields across the farm by about one tonne per hectare,” Broden says at his property near Thuddungra, north-west of Young in southern New South Wales.
“If you take out our grazing crops, our 2020 wheat yielded 6.7t/ha on average and our previous best was 5.7t/ha on average,” he says of his latest results.
Protein approach
Broden says protein maps are a simple way to determine which areas need more urea and which need less. The family’s aim is to have grain protein levels and yields relatively consistent across the farm.
To develop maps to vary urea application rates, Broden sources protein data from the previous wheat crop. This is collected by a CropScan 3000H protein meter.
The family started mapping grain protein during 2016. A grain analyser was originally bought so that grain of different protein levels could be mixed before sale, however they soon found another use for the data.
In 2016, Broden discovered the grain produced from many areas of their paddocks was low in protein. Some areas produced grain at eight per cent protein while other areas produced grain at 14 to 15 per cent protein.
In 2017, he started using the data to differentially apply urea across paddocks. Areas of paddocks that produced wheat with higher grain protein levels were given less urea and areas that produced wheat with lower protein levels were given more.
Broden uses AFS Farm Works software to look at the protein maps and uses a formula to make variable-rate urea maps. The formula (see Table 1) works on putting more urea on low-protein areas and less urea on high-protein areas.
He spends two to three hours making the variable-rate urea maps. The maps are loaded into a Trimble FMX serial rate control fitted to their Amazone Profis Spreader and Amatron 3.
Broden has used the formula over the past three years and found it to be relatively accurate for the soils on their farm.
Table 1: The formula used for variable-rate ure application applied according to the protein levels in the previous crop.
Protein percentage | Urea rate applied (kg/ha) |
Less than 13.5 | 30 |
Less than 12.5 | 60 |
Less than 11.5 | 90 |
Less than 10.5 | 120 |
Less than 9.5 | 150 |
Less than 8.5 | 180 |
Source: Broden Holland.
In 2016 and 2017, grain protein levels across the farm varied by three to five percentage points, but by 2020 (see Figure 1) the variation had decreased to just one to two percentage points, Broden says.
He says that in 2020, all wheat produced was delivered into the Australian Prime Hard 2 bin because their wheat averaged 12.3 per cent protein at 6t/ha across their entire farm. The wheat results achieved in 2020 compare well to the family’s 2016 results, when wheat averaged 4.5t/ha (due to hail damage) at 11.2 per cent protein.
Figure 1. Wheat protein percentage in 2018 versus 2020.
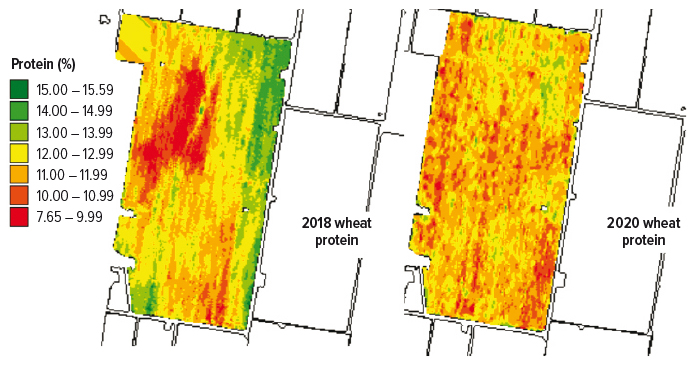
Source: Broden Holland.
Target protein
Over the years, Broden says work done in collaboration with consultants at CropScanAg Solutions has quantified 11.9 as the optimum protein percentage they need to target to maximise yield.
The protein target is also consistent with research findings at Wagga Wagga that indicate 12 per cent protein is a reasonable target (see Figure 2).
Figure 2. Relationship between wheat grain protein and grain yield indicating 12 per cent protein achieved the optimum yield at Wagga Wagga during 2017.
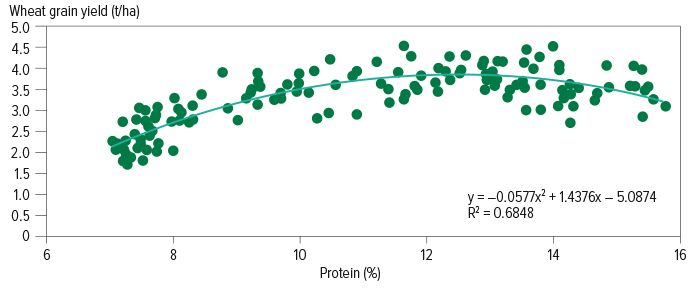
Source: Adapted from Table 2, page 225, Grains Research Update Wagga Wagga, 2018, by Sandral et al. https://grdc.com.au/__data/assets/pdf_file/0032/293576/GRDC-Wagga-Wagga-update-proceedings-2018.pdf.
For further analysis, Broden outsources some data to CropScanAg Solutions to help with decision-making and to gain further insight into their variable-rate nitrogen strategy.
Generally, he applies a blanket application of 60 kilograms/ha of monoammonium phosphate (MAP) at sowing.
“In 2020, most of our wheat was given about 350kg/ha of urea, with rates varying from 200kg/ha up to 600kg/ha.” The small areas that received 600kg/ha were the only areas that hayed off in 2020, he says.
In 2020, urea was top-dressed in three separate applications, starting in June. If more rainfall was forecast, more urea was applied to achieve a 6t/ha target wheat yield.
Lessons learned
GRDC grower relations manager Graeme Sandral says nitrogen budgets are still required when using variable rate technology to apply urea.
“At its simplest, this needs a knowledge of what proportion of the crop’s nitrogen will be supplied from soil mineralisation,” he says.
On the Holland family’s farm, Broden says deep nitrogen tests have shown the soil supplies between 50 and 70 per cent of the crop’s requirements.
“However, this can be lower where cropping has continued for longer phases. This is why we aim to not deplete our mineral nitrogen supply,” he says.
“We then estimate our top-up urea requirements and variable-rate maps based on the previous wheat protein map.”
Aim for consistency
To those considering using grain protein to indicate paddock nitrogen needs, Broden says he would suggest using variable-rate technology to differentially apply urea until yield and protein are relatively consistent across paddocks.
“For us, it has improved yields in historically low-protein areas and reduced haying-off in historically high protein areas,” he says.
“Overall, we now have higher yield and protein levels with less variation in protein and this technology has helped us gain confidence in driving higher yields through generally higher urea rates that are targeted within paddocks.”
Once grain protein is even across paddocks, stacking yield maps and identifying consistently lower-yielding areas will indicate parts of paddocks that need to be checked for other deficiencies, or constraints, using strategic deep soil sampling and an assessment of topography, he says.
More information: Broden Holland, 0447 833 586, bghwr250@gmail.com