


Key points
- The link between wheat grain protein and the adequacy of nitrogen nutrition is well documented
- A FarmLink Research and Precision Agriculture project has explored the potential to use this relationship to improve site-specific nitrogen management within five research paddocks
- The study found wheat grain protein correlated significantly with zero-to-60-centimetre soil mineral nitrogen at four of the five paddocks, and was a good indicator of plant-available soil nitrogen supply at all sites
- Wheat grain protein (or ‘nitrogen adequacy’) maps could improve site-specific nitrogen management and help close the nitrogen-related yield gap in Australian cropping
A new study has established the value of using wheat grain protein levels captured at harvest to inform site-specific variable rate application of urea.
New South Wales-based precision farming specialist Eva Moffitt, from EM Ag Consulting, explored the link between grain protein levels and soil mineral nitrogen as part of a two-year FarmLink Research and Precision Agriculture study.
After finding almost no scientific literature that explored spatial patterns of grain protein variability in Australia, Ms Moffitt applied for a National Landcare Program Smart Farms Small Grant in early 2019 and was successful.
“Like many good ideas, innovation and evolution combined and that’s where I came across Chris and Broden Holland from Thuddungra, New South Wales,” she says.
“They were initially using the grain protein monitor to segregate gain quality at harvest, however this quickly evolved into using the grain protein data to map paddocks for this trait and then applying this data to variable rate urea applications in subsequent crops.”
Concept demonstrated
Ms Moffitt says numerous small plot studies have demonstrated the link between grain protein concentration and the adequacy of nitrogen nutrition.
For example, Dr John Russell of the South Australian Department of Primary Industries and Regions found that wheat grain protein levels of less than 11.4 per cent could indicate soils would be responsive to nitrogen fertiliser back in 1963.
“Subsequent studies have indicated slightly higher values, however, as a general rule of thumb a wheat protein concentration of 11.5 to 12.0 per cent still appears valid as the ‘sweet spot’ where nitrogen nutrition has been optimised for maximum yield,” she says.
“In theory, assessment of a wheat protein map will quickly indicate areas within a paddock that were yield constrained due to nitrogen deficiency. These areas may represent ‘low-hanging fruit’ in terms of potential yield response to increased nitrogen fertiliser applications. Conversely, higher protein areas may represent nitrogen oversupply, where nitrogen inputs could be potentially reduced.”
Accordingly, she wanted to validate these relationships by assessing correlations between grain protein concentrations and soil mineral nitrogen levels in paddock-scale research.
She was also keen to assess the overall level of nitrogen variability present within typical dryland cropping paddocks in southern NSW.
“Deep soil nitrogen sampling is reasonably expensive and is generally only performed at low spatial resolutions. If we are to assess the value of site-specific nitrogen management, we first need to gain an understanding of how variable the landscape is,” she says.
Paddocks selected
In 2019, Ms Moffitt selected four wheat paddocks and one barley paddock where data from on-the-go grain analysers fitted to harvesters showed grain protein levels varied within paddocks.
The study area was 511 hectares, spread across five paddocks on five separate farms. The paddocks were located near Ardlethan, Rannock, Temora, Thuddungra and Ungarie, NSW.
During February and March 2020, Precision Agriculture staff collected soil samples in zero to 30 centimetres and 30 to 60cm segments on a grid basis (every 108 x 108 metres) across the five paddocks. The sampling grid was matched to the width of the growers’ urea spreaders.
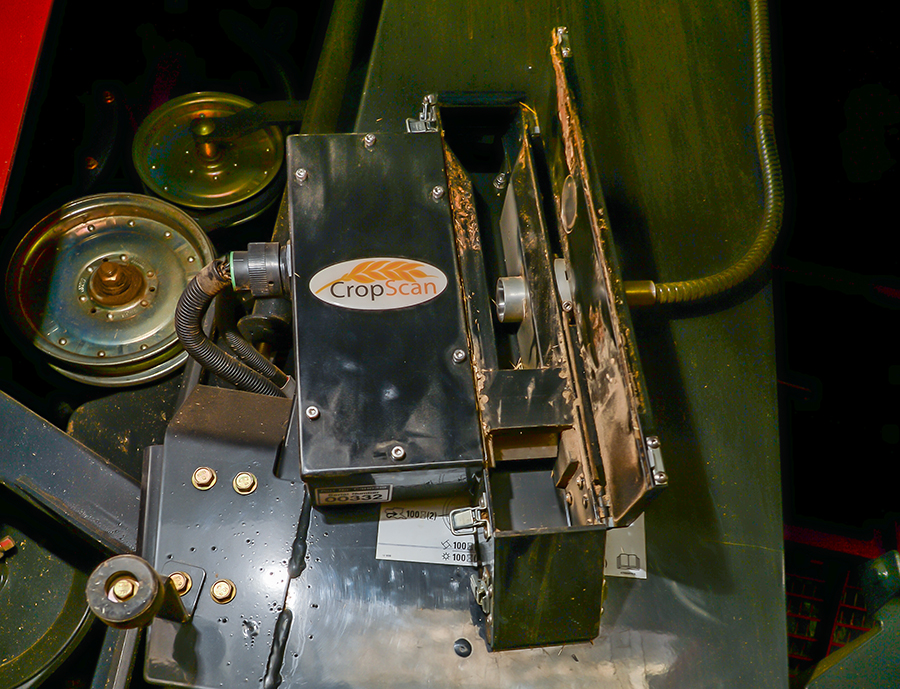
A grain analyser fitted to a harvester offers an insight into the adequacy of nitrogen supply in the paddock. Photo: Nicole Baxter
The Australian Precision Ag Laboratory (APAL) staff measured nitrate, ammonium, soil texture and organic carbon levels for each of the grid sites.
Additionally, Precision Agriculture collected EM38 surveys and strategic soil tests to measure salinity (electrical conductivity, chlorides), cation exchange capacity, sodium and pH.
The 2019 harvest protein patterns were compared to 2020 pre-sowing deep nitrogen soil test results, and other variables, to identify the most important relationships present.
In 2020, Ms Moffitt worked with the five collaborating growers and their advisers to develop a ‘best-bet’ variable-rate urea application map for each of the five paddocks. Four of the paddocks were sown to canola and the fifth paddock was sown to wheat.
Nitrogen-rich and nil or low-urea strips were added to each paddock to assess yield potential and determine the success of the variable-rate urea application strategy.
In November and December 2020 after harvest, Precision Agriculture staff collected a final round of deep soil samples to assess residual mineral nitrogen.
Paddock results
In four of the five paddocks, Ms Moffitt says there was a significant positive correlation between the 2019 grain protein percentages (from three wheat crops and one barley crop) and 2020 pre-sowing soil mineral nitrogen levels (see Figure 1 as an example).
Figure 1: Similarity between 2019 wheat grain protein levels across the landscape and 2020 plant-available nitrogen1.
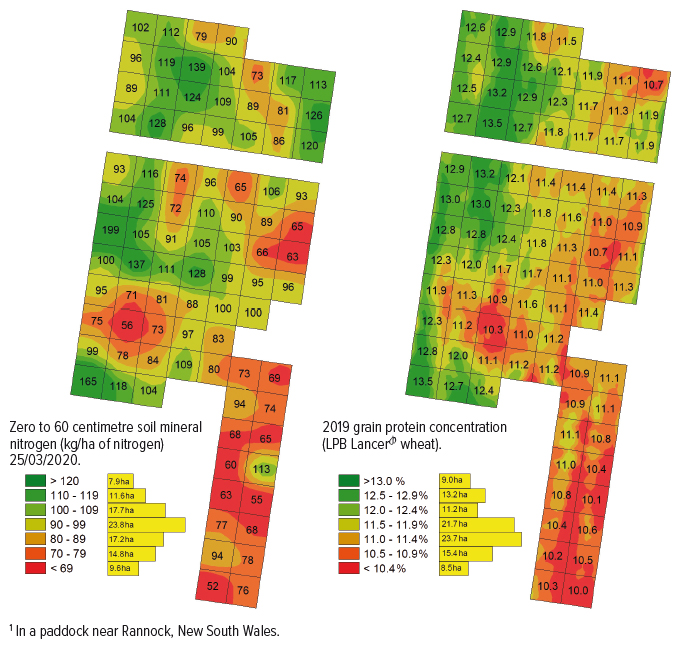
Source: Eva Moffitt, EM Ag Consulting.
“The correlations were generally quite good, and where in some cases the correlations were not as good, they were likely explained by frost in lower lying parts of the paddock,” she says.
“When interpreting grain protein data, it is important to consider the season – in this case 2019 crops were moisture-limited and impacted by frost.”
Nonetheless, she says, the areas within the four paddocks that recorded the lowest grain protein percentages consistently had the lowest soil mineral nitrogen levels.
“In a number of paddocks, 2019 grain protein data and subsequent deep nitrogen tests identified areas that had only 20 to 30 kilograms per hectare of soil mineral nitrogen leading into the 2020 season, which is very low,” she says. “In all cases, our grower collaborators were unaware these nitrogen deficiencies existed.”
Ms Moffitt says these areas would not have been identified with traditional paddock-scale deep nitrogen soil sampling, as soils of higher and lower nitrogen levels would have been bulked together.
A year later, after variable-rate urea maps were developed and deployed in four of the five paddocks, she says canola growth was generally even within zones of similar yield potential.
“Canola yields were no higher on the nitrogen-rich strips, suggesting nitrogen nutrition was adequate,” she says.
“Residual nitrogen levels were also much more even than pre-sowing levels. Although there was a huge draw-down on soil mineral nitrogen due to the exceptional yields in 2020, the results showed only a few areas had very low residual nitrogen levels.”
These areas coincided with zones that were initially depleted of nitrogen and, despite higher urea inputs in 2020. She suspects these areas will take several years to rebuild to adequate soil nitrogen levels.
Driving factors
Ms Moffitt says the spatial variability in nitrogen levels observed was driven by a range of factors.
“Soil characteristics and topography were major factors in a number of paddocks. For example, at Rannock, lower protein and soil mineral nitrogen levels were evident in two higher-elevation areas of the paddock, which are less exposed to frost and have been historically more productive,” she says.
“At other sites, coarser-textured, lower-buffering-capacity soils had lower protein and soil mineral nitrogen levels than finer and heavier soil types within the same paddock.”
Management history also played a major role. For example, where previously separate paddocks had been merged there are often significant legacy effects observed.
“At the Thuddungra site, variability was most strongly linked to a previous variable-rate manure application undertaken to address variability in soil phosphorus levels,” she says.
“While the chicken manure has improved phosphorus levels, it has also led to a lot of variability in nitrogen, which was indicated by the grain protein of the following wheat crop. This can be corrected over time with urea.”
In many cases, she says, multiple factors were responsible for grain protein variation. For this reason, the best results are unlikely to be obtained using soil type zones in isolation as a basis for variable rate nitrogen.
Paddock five
Ms Moffitt says the paddock at Ardlethan – where no correlation was found between wheat grain protein and the mineral nitrogen in the soil – was deficient in nitrogen overall.
“Despite low product removal over the previous few dry seasons, pre-2020 sowing deep nitrogen tests revealed zero to 60cm soil mineral nitrogen levels of only 30 to 60kg/ha across the area.
“Interestingly, however, 2019 wheat grain protein levels varied from as low as 6.5 per cent through to about 12 per cent.”
When comparing these trends to EM38 and soil texture data, she says the lowest protein values correlated significantly with areas of higher electrical conductivity and higher clay concentrations. These areas also had high salinity, sodium and pH in the subsoil.
“For about one-third of the paddock where subsoil hostilities were not present, and protein was higher, it is possible wheat roots may have penetrated beyond 60cm and accessed nitrogen from deeper within the soil profile,” she says.
Given the conflicting results obtained between protein and soil mineral nitrogen patterns, the nitrogen input strategy for the 2020 wheat crop was simplified to a blanket rate of 80kg/ha of urea with two nitrogen-rich strips at 160kg/ha of urea.
After harvest, assessment of the 2020 wheat protein data showed a strong correlation to the 2019 wheat grain protein data both on and off the nitrogen-rich strips. “This suggests the patterns of soil nitrogen supply were consistent across the two seasons,” she says.
The harvest results also demonstrated a strong yield and protein response on the nitrogen-rich strips.
“While the protein response to additional nitrogen was consistently about two per cent, the yield response was greatest, at about 0.8 to 1t/ha, within the area of the paddock containing lower overall protein percentages,” she says.
“This suggests that allocating 2020 urea based on 2019 wheat protein patterns would likely have produced the highest overall yields and the most favourable return on investment given a fixed nitrogen budget.”
Promising results
Ms Moffitt says the study provides compelling evidence that grain protein data can be a valuable tool for assessing within-paddock nitrogen variability, highlighting nitrogen-deficient areas and as a basis for variable-rate nitrogen applications.
“At the Ardlethan site, results suggested that protein maps may have actually been more useful than expensive deep nitrogen grid soil sampling. This can potentially be explained by the wheat protein maps providing a better indication of plant-available nitrogen, which will vary according to rooting depth.”
Despite these promising results, she highlights that challenges exist. “Grain protein data doesn’t tell you how much urea to spread – merely where you should put more and where you should put less. A decision-making process is still required to determine the rate.
“Wheat grain protein is also influenced by seasonal conditions, with a dry finish pushing up protein compared to wet conditions.”
Accordingly, she does not think it is possible to develop nitrogen input rates specific to protein values that will apply to all areas in every season.
“At this stage I would recommend using targeted deep nitrogen soil testing based on protein zones to determine base fertiliser rates.
“Zonal-based soil sampling plans and variable-rate urea application maps would be improved by employing a number of additional tools, including apparent electrical conductivity maps, for example EM38, strategic subsoil health testing, historic aerial imagery, grower knowledge and in-season remotely sensed imagery, for example normalised difference vegetation index.”
She says there is substantial potential upside to improving within-paddock nitrogen management.
“Research has shown that the single greatest factor contributing to the substantial yield gap in Australian wheat production is nitrogen deficiency,” she says
“While an on-the-go grain analyser costs about $25,000, this can also be recouped by using the knowledge generated to blend or segregate low-protein grain with high-protein grain to achieve price premiums.”
Canola and barley
Although the project demonstrated a reasonably strong relationship between wheat protein and soil nitrogen supply, Ms Moffitt says that canola oil and protein percentages were not reliable indicators, at least in 2020.
“The lack of relationship observed may be explained by the influence of climatic factors, such as temperature and moisture, during critical periods of flowering and pod fill on canola oil and protein concentrations,” she says.
“Further research is required to assess the potential role, if any, of canola oil and protein data on informing variable rate nitrogen applications. The barley paddock did give a reasonable indication of soil mineral nitrogen levels, but it was just one paddock in our study. More research is needed to validate this finding.”
Other opportunities
She says the usefulness of wheat protein maps is not confined to nitrogen management.
“If an area of a paddock has a protein level of more than 12 per cent, however, is low yielding, it indicates some other non-nitrogen factor is constraining productivity. This could help direct more-targeted soil sampling to diagnose the issue. If the constraint can’t be overcome, fertiliser rates can be cut back in those areas which have demonstrated lower yield potential, which will be more efficient for the system overall.”
In this sense, an ‘optimal’ outcome is not necessarily an even yield across a management area, but it is achieving maximum yields according to the moisture-limited yield potential across all areas.
“The strategy of using wheat protein (or ‘nitrogen adequacy’) maps to manage within-paddock nitrogen variability, therefore, may offer a solution to close the nitrogen-related yield gap in an environmentally responsible manner.”
Going forward, she says, further research across a larger cohort of paddocks sown to a range of varieties in differing rainfall zones and soil types is needed to further develop this approach.
More information: Eva Moffitt, 0437 189 025, eva.moffitt@outlook.com