


Key points
- In-paddock variability can have a substantial impact on soil nutrient status and yield potential
- By taking soil tests from each production zone, growers can better identify areas where variable rates of fertiliser may translate into higher profits
More intensive zone soil sampling has the potential to boost nutrient investments on variable soils
With fertilisers often the largest single variable expense for growers, money spent on soil testing will help maximise the return on that investment by optimising those inputs and crop yields. Yet in paddocks with variable soil types, testing can often be insufficient to understand the variability and identify potential gains.
To demonstrate how intensive soil and plant testing can improve fertiliser decisions and maximise returns for growers, GRDC has invested in research in the southern region. The project, which started in 2018, is led by Agronomy Solutions in partnership with Nutrien Ag Solutions, AgCommunicators, Australian Precision Ag Laboratory and CSIRO.
Paddock demonstrations
Working with growers in South Australia and Victoria, researchers identified more than 300 paddocks with variable productivity and intensively sampled soil for nutrient analysis in two different one-hectare production zones prior to sowing in 2019. Of these, 150 paddocks were selected to trial different fertiliser rates applied as strips across the full width of the paddock, including the intensively sampled zones.
At sowing, the growers applied phosphorus at zero, their standard rate and double their standard rate. If soil tests indicated phosphorus levels were already high, an additional half rate was included. AT other sites, nitrogen strips were also top-dressed as required, but are not reported in this article.
By comparing wheat yield map data, dry matter and plant tissue analysis with the soil test results and fertiliser rates, researchers were able to better understand the variable responses in the different production zones.
Variability
In 2019, the soil nutrient status was highly variable across many of the paddocks tested in the project. For example, in a paddock in the Victorian Southern Mallee, soil tests indicated marginal soil phosphorus in Production Zone 1 and the DGT P results predicted a deficiency in Zone 2. While deficiency was not predicted by Colwell P, the higher phosphorus buffering index observed in Zone 2 is typically associated with higher critical Colwell P targets.
In this paddock, phosphorus was applied in double-seeder-width strips at zero, half rate (4.4 kilograms of phosphorus per hectare), standard (8.8kg P/ha) and double (17.6kg P/ha). The yield results showed just how variable the productivity was across the full width of the paddock (see Figure 1). There were significant yield improvements observed in the phosphorus-deficient Zone 2 for the double rate compared with the standard rate, and no significant differences between any of the rates in Zone 1.
Figure 1. Harvest yield data strips across the full paddock width demonstrate yield variability across the paddock. The double rate of phosphorus (17 kg P/ha) has significantly improved yield compared with the standard rate (8.8 kg P/ha) in Zone 2, where intensive soil testing identified a phosphorus deficiency. Zone 1 was not considered deficient and there was no significant difference between phosphorus treatments.
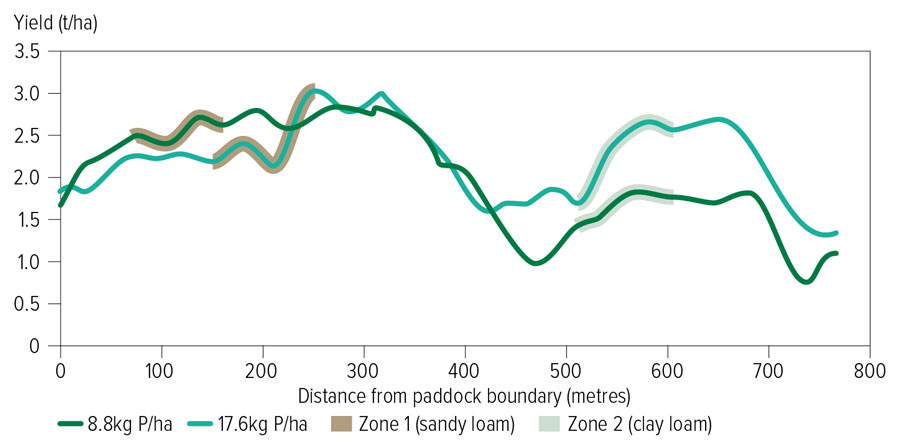
Source: CSIRO
The results for this and other paddocks demonstrate that growers need to increase sampling intensity and sample more than one soil type or production zone in each paddock.
These grower demonstrations were continued in 2020 and researchers are also investigating the potential for large-scale grower-replicated trials (100 metres long and three seeder-widths wide) to help overcome the influence of paddock variability on interpreting the response to different rates of phosphorus fertiliser.
More information: Dr Harm van Rees, harm@cropfacts.com.au, 0419 325 252; Soil testing for crop nutrition fact sheet; Soil and plant testing for profitable fertiliser use GRDC Update paper