


Key points
- Identification of the nature of a soil constraint is the first step in managing paddock variability
- EM38 technology can be used to identify soil constraints but must be ground-truthed using yield maps and other sensing tools for a specific location
- Site-specific soil and nutrient management are cost-effective, economical and environmentally positive
The major factor that determines crop productivity across Australia is water supply. Further constraints to plant growth can be posed by soil physical and chemical constraints, which affect the ability of plant roots to extract water and nutrients.
These soil constraints vary both laterally across the landscape and vertically within the soil profile. By identifying the spatial variability of soil constraints, grain growers can develop appropriate site-specific agronomic management strategies to improve productivity.
Soil sampling to identify these soil constraints is time-consuming and expensive. With these concerns in mind, GRDC has invested in research with the University of Queensland (UQ) to evaluate advanced techniques for evaluating subsoil constraints in the northern region.
Approach
Crop management is often informed by concepts of water balance. The amount of stored water available to a crop is strongly dependent on the soil's plant-available water capacity (PAWC) - or the soil's 'bucket size' - which, in turn, depends on the soil's physical and chemical characteristics and the characteristics of the crop being grown.
The interpretation and utility of apparent electrical conductivity (ECa) readings are highly location and soil-specific, so soil properties influencing the measurement of ECa must be clearly understood.
Two fundamental measures of PAWC are the drained upper limit (DUL) - the amount of water a soil can hold against gravity - and the crop lower limit (CLL), which is the amount of water remaining in the soil after a particular crop has extracted all the water available to it.
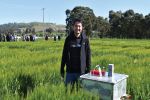
Adopting these water-balance principles, the aim of this research was to investigate the use of proximal sensing (EM38) and remote sensing (normalised difference vegetation index or NDVI) to identify potential soil-management classes and develop a framework to estimate economic and environmental benefits of site-specific crop management options. The research used seven cropping paddocks across Queensland and northern New South Wales (see Figure 1).

The paddocks were surveyed using a Geonics EM38 linked to a data logger and differential GPS (dGPS) to determine variation in electrical conductivity (EC). The dGPS was mounted on a vehicle and the sensor towed behind on a conveyor belt mat.
The seven growers harvested their crops with machinery fitted with yield-monitoring equipment and yield maps were generated.
To determine whether management by potential soil class was justifiable over conventional blanket paddock management, paddock-scale replicated trials using a range of nitrogen, phosphorus, gypsum and compost treatments were applied. Grain yield was measured with a yield monitor at the end of the season.
Generating maps
EM measures the soil electrical conductivity and the signal is related to water, salt and clay content of the soil. The interpretation and utility of apparent electrical conductivity (ECa) readings are highly location and soil-specific, so soil properties influencing the measurement of ECa must be clearly understood.
For the trials in this study, ECa measured using the Geonics EM38 showed strong negative correlations with grain yields both at DUL and CLL but more strongly with CLL. For this reason, EC measurements at CLL were used to identify potential soil-management classes.
For northern region soils, EM38 readings can be ground-truthed and reliably correlated to the crop lower limit to identify subsoil constraints for site-specific management.
Using this information, together with ground-truthing information such as yield performance (yield maps), remote sensing images (NDVI), landscape attributes, pre-clearing native vegetation species and other soil characteristics from soil tests, the paddocks were classified into different management classes for each of the seven sites.
Table 1 gives examples of how the soil classes were characterised at two of the study sites; three classes were identified at Biloela and two at Garah.

Ground-truthing
The paddocks were sampled for the soil's physical and chemical characteristics - soil chloride (Cl-), sodium (Na+), electrical conductivity of saturated soil extract (ECse), exchangeable magnesium percentage (EMgP), exchangeable sodium percentage (ESP), nitrate nitrogen (NO3-N) and volumetric moisture content (VMC) - for ground-truthing the cause of this variability. Examples of the data obtained from Biloela (Site 1) and Garah (Site 2) are illustrated in Figure 2.

A total of 16 and 12 soil sample locations were selected at Site 1 and Site 2 respectively, covering each productivity zone (Figure 3).
Two soil samples were taken per location to 1.5 metres and then divided into intervals; a surface interval (zero to 0.1m) and then successive 0.2m intervals.
Figure 3 shows the soil class maps for the two sites, the brown arrow in each map is the direction of paddock operations whilst the white dots and numbers denote the locations of the soil samples taken in each paddock.
 Site 1, Biloela and (b) Site 2, Garah. SOURCE UQ")
Figure 3: Potential soil management classes based on grain yield and ECa-CLL for (a) Site 1, Biloela and (b) Site 2, Garah. Source UQ
Managing variability
Figure 4 shows the yield response to applied nitrogen for the three potential management classes at the Biloela site. No significant response to applied nitrogen was obtained in the low-yielding (constrained) class; however, significant linear increases were obtained for wheat grain yield for both the medium and high-yielding (unconstrained) classes.

Figure 4: Wheat yield response to applied nitrogen in the low, medium and high-yielding management classes at Biloela. Source UQ
The nitrogen requirement for each management class (Table 2), calculated using realistic yield potential, soil nitrogen at zero to 0.9m, and a protein goal, showed that the low-yielding class (20 hectares) had substantial unutilised nitrate nitrogen in the soil profile.
Application of nitrogen at 46 kilograms/ha to this class - the grower's conventional practice - results in net wastage of two tonnes of urea.

At a standard price of nitrogen, this is worth $46/ha/year. The conventional application for the medium-yielding class appears to be well-prescribed, with negligible wastage evident.
The high-yielding class (16ha), on the other hand, is under-fertilised by the conventional application rate, with an additional 3.9t urea required.
At the Garah site, applied nitrogen up to 50kg/ha significantly increased barley grain yield in both the low-yielding (constrained) class and the high-yielding (unconstrained) class (Figure 5).
However, in the constrained class, the gross margin was $45/ha at 50kg/ha and decreased to -$12/ha at 100kg/ha, while in unconstrained areas the gross margin was $49/ha at 50kg/ha and decreased to $10/ha at 100kg/ha.

Figure 5: Barley yield response in the first year to applied nitrogen, gypsum and compost in the low and high-yielding classes at Garah. Source UQ
Both gypsum and compost significantly increased barley grain yield in both the constrained and unconstrained classes in the first year of its application (Figure 5).
Key learnings
The ECa showed strong negative correlations between grain yields both at DUL and CLL, but more strongly with the latter. Strong correlations among ECa-CLL soil properties associated with soil constraints and winter cereal grain yields indicated that ECa-CLL allocated management classes satisfactorily.
Simple on-farm experiments were shown to provide an excellent framework to make management more precise by targeting constraint areas of the paddock or farm.
Furthermore, matching fertiliser nutrients to realistic yield potential in the presence of subsoil constraints saved from $19/ha to $45/ha per year, and site-specific gypsum application resulted in cumulative profit of $143/ha over three to four years, with increased PAWC and water-use efficiency.
GRDC Research Code DNR00008
More information: Yash Dang, University of Queensland, y.dang@uq.edu.au, 0427 602 099.