


Key points
- The best lime has the most neutralising value per dollar. Smaller lime particles with higher neutralising value change soil pH faster than large particles
- There are a variety of online calculators to compare lime sources. iLime is a sound calculator choice
- A good liming strategy that targets where and how lime is applied is more important than minor differences in lime quality and cost
From a return on investment (ROI) point of view, the ‘best’ lime is the cheapest one that achieves a given increase in soil pH. It is important to work out the best lime for your situation by considering lime effectiveness and costs (product, transport and application), because they vary considerably.
How well lime works depends on its neutralising value (NV) and particle size distribution. NV is the overall ability to change soil pH, measured by the carbonate content relative to pure calcium carbonate (CaCO3); higher NV means the lime can tackle more acidity. Particle size affects how fast this change will happen. Smaller particles have more contact with the soil so they react and dissolve faster and more uniformly through the soil, especially at low soil water content.
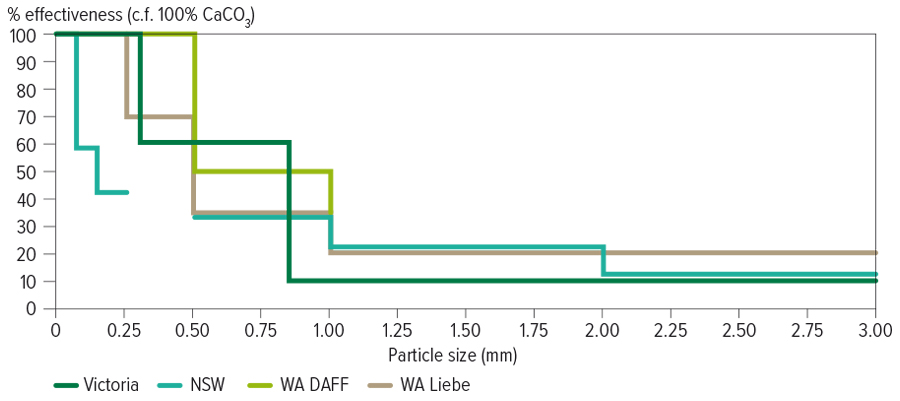
As particle size and NV are the key determinants of lime efficacy, when evaluating a lime product it is crucial to separate it into different particle size fractions and measure the NV of each fraction. Combined, this gives the effective neutralising value (ENV). More fine particles with a higher NV mean a higher ENV. As larger particles are less effective at neutralising acidity, larger fractions are discounted to account for their lower efficacy. For example, the Soil Quality Lime Comparison Calculator discounts particles 0.5 to one millimetre in size by 50 per cent (Figure 1).
Calculating the ENV is especially important for on-farm lime. Finer fractions might be dominated by clay that has little carbonate in it and therefore have a low NV. A bulk sample analysis of on-farm lime, while cheaper, is best kept for preliminary analyses when scouting out potential on-farm lime sources.
Figure 1: Comparison of assumed particle size efficacy for various lime comparison calculators.
Wet versus dry sieve
Sieving lime samples, by a dry or wet method, separates samples into different particle size fractions. Dry sieving shakes the sample through a stack of different sized sieves; wet sieving uses water to wash the sample through the sieves.
Theoretically, wet sieving should more accurately determine particle sizes because it breaks softer aggregates into smaller components. It also washes fine particles off larger ones, which happens to a lesser degree with dry sieving. However, there are concerns that wet sieving does not represent what happens in the paddock; some aggregates can take years, even decades, to break down in the paddock, not immediately as wet sieving would suggest. The outside of aggregates can neutralise soil acidity, but in doing so creates an alkaline shell, rendering the rest of the aggregate’s neutralising capacity ineffective unless and until it breaks down.
Wet sieving, therefore, can overestimate the smaller fractions and ENV of a lime source compared to what happens in the paddock, leading to a slower-than-expected pH change in the paddocks and a lower ROI in lime. Dry sieving is more representative of what Western Australia’s limesand and crushed limestone do in the paddock. It can be less reliable for very small particles (less than 0.05 mm) (Conyers et al. 1995) but these represent an insignificant fraction of lime sources available in WA.
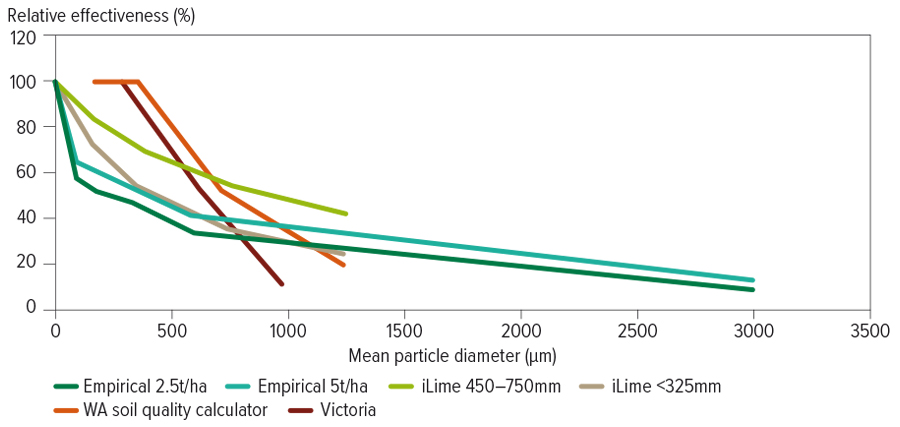
Figure 2: Comparison of particle size NV efficacy for three lime comparison calculators to field data from Mark Conyers pers. comm. 2019.
Lime comparison calculators
Lime comparison calculators combine the ENV with costs (product costs, transport and spreading) to calculate and compare how much carbonate is supplied per dollar for each product. There are multiple calculators available online, with different calculations behind them that give different end results.
The Soil Quality Lime Comparison Calculator has been widely used in WA for the past 20 years. It is based on pH changes over time. Samples from 29 WA lime pits were sieved into different fractions, and each fraction applied to soil of a known pH. Soil pH was tested at two, four, eight and 16 weeks, and compared to a negative control (no lime added) and a positive control (with CaCO3). Multi-regression analysis was used to calculate an average NV for the different particle size fractions.
With increasing awareness of on-farm lime sources, the soil quality calculator has been compared to the NSW Limestone Efficiency Calculator and a Victorian calculator. The NSW calculator is based on NSW field trials from the late 1980s/early 1990s, using 98 per cent pure calcitic limestone from a quarry in NSW.
The more recent iLime app calculates the total surface area of pure lime (CaCO3) that can react in soil over time, and the potential pH change in each soil layer (0 to 10 centimetres, 10 to 20cm, 20 to 30cm) (DPIRD 2019) . This is used with information about the soil, production and lime strategy, specific to the paddock in question, to estimate the ROI from liming.
There has been a lot of conjecture around which calculator is ‘right’ because:
- they are based on pH changes from using vastly different lime sources in different soil types; and
- they apply different discount factors to the larger particle sizes when calculating ENV (Figure 1). For example, in WA a particle of 0.25mm is considered 100 per cent effective, but in NSW it is considered 42 per cent effective.
To help sort this conjecture out, soil scientist Mark Conyers compared field research on how different particle sizes affect pH change to the WA, NSW and Victorian calculators and iLime (Conyers et al. 2020). The aim was to see which calculator particle size efficacy values had the closest fit to the field data.
For particles up to 1mm in size, the iLime predictions were closest to the field values and had the best overall fit to the field data (Figure 2).
Conclusions with regards to sieving and calculators are that:
- iLime is a good way to compare the cost effectiveness of a diverse range of lime products. WA Department of Primary Industries and Regional Development recommends using iLime (developed as part of GRDC project DAW00236) to compare lime sources. See the link to ‘iLime tips and tricks’ on the iLime website;
- the Soil Quality Lime Comparison Calculator is useful for mainstream WA limesand and limestone;
- wet sieving mainstream WA limesand and limestone will not be much different to dry sieving; and
- interpretation of wet sieving results for on-farm lime sources should consider potential overestimation of ENV compared to what happens in the paddock.
Reviewed by James Fisher (Desiree Futures), Chris Gazey (DPIRD), Mark Conyers (Soil Scientist).
This article was produced as part of the GRDC ‘Maintain the longevity of soils constraints investments and increase grower adoption through extension – western region’ investment (PLT1909-001SAX).
This project is extending practical findings to grain growers from the five-year Soil Constraints – West suite of projects, conducted by the Department of Primary Industries and Regional Development (DPIRD), with GRDC investment.
References
Conyers M K, Scott B J, Whitten M G 2020. ‘The reaction rate and residual value of particle size fractions of limestone in southern New South Wales’. Crop and Pasture Science. https://doi.org/10.1071/CP20045
Conyers M K, Scott B J, Fisher R and Lill W 1995. ‘Predicting the field performance of twelve commercial liming materials from southern Australia’. Fertiliser Research, 44, 151-161.
DPIRD 2019. iLime technical notes. Version 1, released July 2019.