


Australian grain growers lose billions of dollars each year thanks to frosts and hot weather during sensitive crop developmental stages.
To date, growers and advisers do not have an accurate and quick way to assess the yield loss of their crops soon after spring frosts and hot days.
GRDC is investing in major, new, four-year projects with CSIRO and the University of Sydney to make this happen. The projects will link researchers with agricultural technology companies to deliver next-generation decision-support tools.
The new digital products will make decision-making simpler for growers with paddock planning and tactical responses during the growing season following a frost or damaging hot weather.
Tom Giles, GRDC’s senior manager for enabling technologies, says the research will create algorithms, called ‘damage functions’, to help growers make choices.
“The researchers come from multiple disciplines such as crop physiology, farming systems and remote sensing. We also have eight ag-tech companies on board. So, we have a really good understanding of what the market wants,” Mr Giles says.
The companies will translate the best-available scientific research, along with new knowledge developed in the projects, into digital agricultural products that will directly help growers.
The companies include Agworld, Data Farming, Pairtree and Hillridge Technology, which will develop a new wave of products.
In addition to research organisations and agricultural technology businesses, the work will be conducted in partnership with growers and agronomists to ensure that the new tools meet the practical needs of the grains industry.
These digital products will give growers and advisers useful information to guide their choices at sowing time and in the spring, immediately after frosts and heat-stress events for wheat, barley, canola, lentil and chickpea crops. The tools will factor in crops’ growth stage and soil moisture levels for specific paddocks in individual seasons.
Mapping paddocks
The major focuses of the research and development are to use advanced techniques to map frost and heat events across paddocks and to predict the yield loss from those events.
The new projects will use knowledge of how plants respond to frost and heat stress, in combination with a range of advanced technologies.
To date, we have not had a way of gathering yield loss data from frosts and heat stress in real-life farming situations over a broadacre area. This is partly because so many other factors come into play, especially with frost damage. These include variation across paddocks, such as elevation, soil type and soil moisture. These factors can influence the severity and duration of extreme temperature events in the crop canopy, as well as the crop’s ability to recover.
The grains industry is also yet to have access to cost-effective and widely validated methods of accurately monitoring crop canopy temperatures across paddocks. A one or two-degree difference at sensitive crop stages can cause 10 to 20 per cent yield loss in some cases. Unfortunately, temperatures measured in weather stations are often two to five degrees different from the canopy temperature.
The information ... will help growers with decisions such as cutting a crop for hay or adding inputs to certain parts of the paddock but not others.
Dr Julianne Lilley, who is leading the CSIRO’s part of the project, says the researchers will use satellite temperature data collected every 10 minutes across Australia. The satellite measures the temperature at the surface of the crop. This is called remote sensing, which can precisely monitor changes without the need for labour-intensive, repetitive measurements.
“For the damage functions, we use existing data from a computer model called APSIM (Agricultural Production Systems sIMulator), plus other models, to see if the crop is at the sensitive growth stage. Then we use the temperature mapping to see if a frost or heat event has occurred. We also take into account water (deficit) stress,” Dr Lilley says.
“When we bring together APSIM and temperature mapping, we can predict the damage to the crop. We can do a historical analysis to determine the risk of frost in this part of the paddock.
“The functions will assess temperature, the severity, duration, how many hours below a particular temperature and how many times that happens. The damage functions and maps will be put on a digital platform to produce information – for example, the crop damage in a particular location.”
The agricultural technology companies will be able to pick up this ‘white label’ format to produce their own product. For example, hay businesses, insurance companies and agronomy service providers could each have their own user interface.
“The information will be provided in real time. It will help growers with decisions such as cutting a crop for hay or adding inputs to certain parts of the paddock but not others,” Dr Lilley says.
“We will link this into another project called Frost Sense, which predicts temperature at a sub-paddock scale, which is important for frost events. We are testing this on 50 to 100 paddocks. This method is somewhat more limiting than satellites as it uses ground sensors in paddocks – a form of proximal sensing.”
Dr Lilley says the project has a lot more study to do on lentil and chickpea crops than canola and cereals, as less phenology research has been undertaken on pulses.
CSIRO’s project is partnering with universities and state government departments to share data from previous frost and heat experiments. These include the Western Australian Department of Primary Industries and Regional Development, NSW Department of Primary Industries, the South Australian Research and Development Institute, Charles Sturt University and, for the pulse crops, the University of Queensland/Queensland Alliance for Agriculture and Food Innovation.
The University of Sydney’s separate project uses a different method to develop the damage functions. It is a data-driven, precision agriculture approach and uses ‘modelling’ to scientifically predict temperatures at different elevations.
The university’s project will use large datasets provided by corporate farming businesses and a commercial partner, Precision Cropping Technologies.
More tailored insurance
The information generated from the projects will also provide opportunities to better tailor crop insurance products.
“The more you understand the likelihood of a frost or heat event occurring, the more affordable the crop insurance should be,” Mr Giles says.
“At this stage, entire regions are sometimes clumped together and given the same frost risk rating for insurance. We know that the risk of damage caused by a frost event at a given location is incredibly complicated. There are so many variables – such as crop variety, topography and the crop’s growth stage.
“These projects will ‘do the science’ to better understand the risk and to quantify the damage to help provide new site-specific frost and heat insurance options.”
Insurance companies might then be able to offer a ‘parametric policy’, which does not require an assessor to inspect a crop to determine the level of damage. Instead, it would be based on a climate measurement.
Linking with other projects
The new projects will build on and use information from other research initiatives supported by GRDC.
For example, the National Phenology Initiative (NPI) will provide information that will be used in the new projects to help growers determine the ideal sowing time for their crops. This will help growers maximise their crops’ yield potential based on varieties’ specific developmental characteristics (phenology), and the chances of frost and heat stress during flowering and soil moisture for an individual paddock, based on historical data.
“The linkage between the NPI and the new frost and heat project is a great testament to the value of playing the long game with digital agriculture,” Mr Giles says.
“By chasing the high-value areas that take time, investment and resilience to crack, GRDC is now in a position to create impact like never before in digital agriculture. It’s especially exciting to see different pieces of the puzzle come together. For example, we can now use gene-driven models to generate the variety-specific flowering time data that’s needed to make this new frost and heat project work.”
What it means for growers
The benefits of the research and development to growers are through simpler agronomic decisions and better risk management.
As a result of this GRDC investment, growers and agronomists should be able to access tools, such as farm management software, to help decide upon:
- optimum sowing dates for individual varieties for a given paddock; and
- the most profitable option following a heat stress or frost event, such as salvaging a section of crop for hay, grazing or harvesting.
The projects will also allow growers to have access to cost-effective insurance products that are based on quantifiable likelihoods of frost and heat damage, specific to individual paddocks.
Benefit to growers
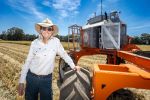
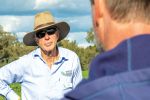
Alexander McRae is a sixth-generation grower who farms with his parents Rob and Janet and his wife Jacinta at Wallup, in Victoria’s north-west. He says he welcomes new technology that will help him with his decision-making.
“We have one weather station and five soil moisture probes on the farm, plus a multitude of rain gauges. I have live access to the data, although I still also look up Bureau of Meteorology weather station data,” Alexander says.
“Frost is really hard – actually, it’s a nightmare. We have variation in soil types and in elevation. In some years we may cut part of a paddock for hay on the (frosted) flats and leave the rises for grain. In some seasons, it makes no difference (in gross margin) whether you cut hay or harvest grain. In good years, hay is worth less, so it can be a hard decision to cut a crop for hay.
“We also run sheep, which helps after a frost. It’s good that lentil crops can be grazed.
“We discuss frost events with our consultant, but the new technology that is being developed in the new project would be useful. It would help make decisions a little easier.”
Next-gen flowering calculator
Over the next four years, growers will have access to digital tools to predict the flowering time of their crops for any commercial canola, wheat and barley variety and any location for different times of sowing.
A new GRDC-supported project with the CSIRO, called the National Phenology Initiative (NPI) Phase 2 will build on information from past projects to estimate variety specific flowering dates across the Australian grainbelt.
CSIRO researcher Dr Julianne Lilley is leading the NPI project, which will develop the tool to allow growers to enter details of their location, variety and sowing date to determine the crop’s flowering time.
The models will be validated by using National Variety Trials (NVT) flowering time data for new and latest varieties. The NVT flowering dates will validate what the scientists predict based on the crop variety’s genetics.
Dr Lilley says the flowering time calculator will give growers a risk profile for their chosen sowing date and variety.
“For example, it may say that if you sow a certain variety of wheat on a certain date, you have an 80 per cent chance of it flowering in the sensitive period for frost or high temperature stress, based on the past 50 years of weather data,” she says.
“For canola, the sensitive period is after flowering.”
She says year-to-year variations in temperatures mean that crops’ developmental rate (phenology) is not always the same.
This project ties in closely with the frost and heat project. The two projects will help growers with planning by predicting the likelihood of yield loss from frost and heat events based on time of sowing, crop variety and location.