


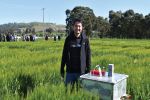


Despite ongoing travel restrictions around the country, snow in the New South Wales Northern Tablelands and minor flood warnings in Tamworth, the iMapPESTS team successfully deployed its new and improved mobile surveillance unit, Sentinel 5, to Tamworth Agricultural Institute (TAI) in June 2021.
In a collaboration between the South Australian Research and Development Institute (SARDI) and NSW Department of Primary Industries (DPI), the mobile surveillance unit was deployed at TAI to monitor high-priority insect pests and fungal pathogens for the grains industry.
The sentinel is one of a suite of mobile surveillance units that incorporate specialised trapping equipment and technology, including three automated samplers – two insect suction traps (a six-metre trap and a 2m trap) and a pathogen spore sampler – as well as onboard telemetry plus a weather station.
The suite of mobile surveillance units was developed as part of the $21 million iMapPESTS project in partnership with the Federal Government’s ‘Rural R&D for Profit’ program and seven plant industry research and development corporations (RDCs). Of these RDCs, GRDC has invested $1.8 million in the six-year (2017–23) project led by Hort Innovation.
The insect suction traps onboard the sentinels have demonstrated effective monitoring of aphid pests in grain-growing regions in previous sentinel trials – for example, early detection of Russian wheat aphid (RWA) at the Hart field site north of Adelaide in spring of 2020 (iMapPests trials: Hart 2).
Based on the success of these previous trials, iMapPESTS reached out to NSW DPI’s Dr Zorica Duric to discuss how the sentinel could contribute to monitoring for early detection of RWA for the region.
Over the course of the trial at TAI, insect suction samples were initially screened by Dr Duric and then sent to SARDI entomologist Rebecca Hamdorf for identification and quantification of RWA, green peach aphid, oat aphid, corn aphid and rose-grain aphid.
A total of 117 aphids were trapped over the 15-week trial, none of which included RWA. This result reflects the weather conditions and increased rain events in northern NSW this year. While numbers of grain aphids trapped were very low, these results were echoed across Dr Duric’s yellow sticky trapping network. In contrast to the low numbers of grain aphids observed during the trial, a total of 1187 onion thrips (Thrips tabaci) were collected over the course of the trial.
Relatively low temperatures and rain events during winter should suppress insect populations in general, including the onion thrips. The increase in the thrips numbers could be triggered by short-term favourable environmental conditions during the season. However, large numbers of thrips in traps do not necessarily equate to damage or numbers in crops.
Weather leads to high disease pressure year
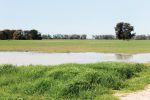
This year was one of the wettest winters for the northern grains region since 2016. It was accompanied by mild temperatures that persisted well into spring, providing ideal conditions for the development of leaf diseases across a range of crops, with growers urged to monitor for symptoms and practice integrated disease management strategies to limit losses.
In a collaboration between iMapPESTS and GRDC co-investment through the Grains Agronomy and Pathology Partnership (GAPP), NSW DPI researchers were keen to track how the population of airborne spores of several key grains pathogens changed over time, and how they could be influenced by seasonal conditions such as wind, rainfall and humidity.
Pathogens targeted over the course of the Tamworth deployment included Septoria tritici blotch, yellow leaf spot, net form blotch of barley, spot form blotch of barley, blackleg of canola, Ascochyta blight of chickpeas, white mold, Botrytis grey mold and chocolate spot of faba beans.
Information generated by the sentinel aligned to diagnostic analyses is visualised on a data dashboard, where key climatic conditions such as temperature, rainfall and relative humidity can be viewed in-line with the presence and abundance of specific pathogen DNA (spores) detected in sentinel samples.
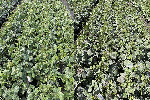
The sentinel was deployed adjacent to a pathology National Variety Trials (NVT) paddock where annual screening of wheat/triticale/durum entries for cereal rust resistance (primarily stripe rust) and chickpea entries for Ascochyta blight resistance takes place.
The residues are retained in this paddock with the chickpea and wheat NVT experiments alternating positions within the paddock each year. Ascochyta blight on the chickpea stubble and pseudothecia of Pyrenophora tritici-repentis (Ptr) were visible on standing stubble of some wheat varieties.
Some of the key highlights from the pathogen monitoring at TAI were:
Yellow leaf spot
Using the spore sampler to track peaks in detection of yellow leaf spot ascospore release over the course of the trial in relation to climatic conditions from adjacent pseudothecia on wheat stubble, researchers were able to examine the relationship between rainfall events and spore release. An improved understanding of this relationship would benefit in-crop fungicide application timings.
Several peaks in detection of yellow leaf spot were observed at the TAI site. Preliminary observations indicate these peaks were initiated after significant rain events followed by prolonged high relative humidity levels.
Initial peaks early in the season (June) were likely related to the release of ascospores from infected stubble in the adjacent paddock, which serves as the primary inoculum source, while later yellow leaf spotdetections from July onwards generally peaked a few days after rainfall events due to the formation of conidia. Consistent with this hypothesis, yellow leaf spot lesions were evident on susceptible varieties within the adjacent trial paddock.
Early detection of non-specific, airborne rusts
While no specific Puccinia species were targeted during the trial, a generic rust assay was used to screen spore samples for the presence and abundance of rusts at the site as a preliminary investigation into the value of this aspect of area-wide surveillance. Rust naturally infects the adjacent NVT experiments via windborne spores when seasonal conditions are favourable.
An early warning system could notify growers and advisers of when windblown rust spores are present within a region, then when to start scouting susceptible varieties for infection and target in-crop fungicide applications. The nature of disease development in the rusts often leads to a cautious approach to management by growers and their advisers where prevention is often considered better than cure.
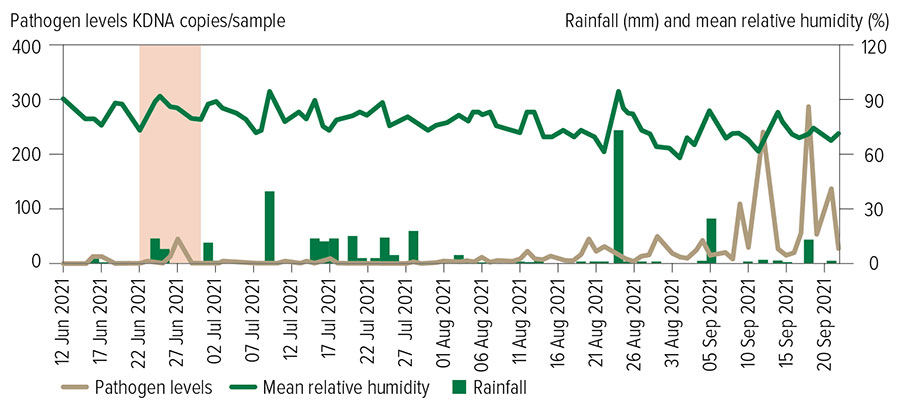
Figure 1: Abundance of non-specific airborne rust spores relative to rainfall (mm) and mean relative humidity (%) over time. Source: iMapPESTS
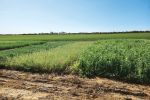
A peak in airborne rusts was detected at the commencement of the trial in mid-June (Figure 1), immediately after a rainfall event throughout NSW (67 millimetres in the three days before sampling commenced). In-crop monitoring of cereal rust development adjacent to the monitoring site at TAI found a ‘hotspot’ of stripe rust four weeks later in mid-July (Figure 1) in a susceptible buffer plot of LRPB Trojan wheat, as anticipated with latent period and multiple cycles before pustules reach detectable levels on susceptible wheat varieties.
Stripe rust infection continued to spread from this initial hotspot throughout the adjacent trial in August. Significant peaks of airborne rust spores in September coincided with severe leaf infections in susceptible varieties, which allowed relative scoring of resistance levels to be determined.
Highlights from the pulse pathogens
In contrast to all other airborne pathogens being monitored, only a few negligible detections of Ascochyta blight DNA were observed from trapping airborne spores from June to September. This region is an intense chickpea growing region, and this data supports numerous research findings that the airborne spores (ascospores) of this pathogen are not the driving factor of disease epidemics. Rather, rain splash is the primary means of spread within chickpea crops.
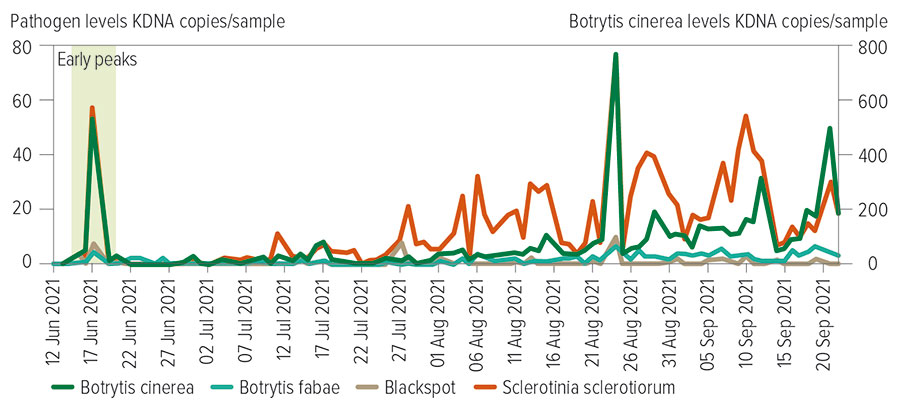
Figure 2: Abundance of airborne spores of pulse affecting foliar pathogens in relation to rainfall (mm) and mean relative humidity (%) over time. Source: iMapPESTS
Important foliar pathogens affecting pulse crops, including those causing chocolate spot, Botrytis grey mould and Sclerotinia diseases, exhibited a significant peak of airborne spores detected early in the season, like that observed in the rust monitoring, immediately after widespread rainfall throughout NSW (Figure 2). This could be an important finding for understanding early establishment of these diseases within emerging crops in the region.
For more information relating to the data from this trial, head to the trial page for Tamworth on the iMapPESTS website.
The iMapPESTS website includes an interactive map of locations for current and previous sentinel trials that links to individual trial pages, where stakeholders can interrogate the data collected for insects and pathogens trapped at a particular site.
More information: iMapPESTS; @iMapPESTS; Dr Zorica Duric, zorica.duric@dpi.nsw.gov.au; Dr Steven Simpfendorfer, steven.simpfendorfer@dpi.nsw.gov.au
The program (2017–23) is supported by Horticulture Innovation Australia Limited, through funding from the Australia Government Department of Agriculture, Water and the Environment as part of its Rural R&D for Profit Program and GRDC, Sugar Research Australia, Cotton Research & Development Corporation, Wine Australia, AgriFutures Australia, and Forest and Wood Products Australia.