


Tools that measure a crop’s ‘greenness’ can help to select wheat varieties tolerant to the root lesion nematode (RLN), Pratylenchus thornei.
The University of Southern Queensland’s (USQ) Centre for Crop Health has found that measuring wheat canopies’ normalised difference vegetation index (NDVI) could speed up the selection process when breeding for P. thornei tolerance.
NDVI is a commonly used index of vegetation or ‘greenness’. It is generated using red and infrared spectral bands of an image. Photosynthetically active vegetation absorbs most of the red light that hits it, while reflecting much of the near-infrared light. Vegetation that is dead or stressed reflects more red light and less near-infrared light.
Breeding varieties tolerant and resistant to P. thornei is important, given about two-thirds of paddocks in the northern region are infested with this RLN. Another RLN, P. neglectus, is found in about one-third of paddocks tested.
These microscopic worm-like organisms invade, feed on and damage the roots of susceptible hosts, limiting the plant’s uptake of water and nutrients. Intolerant wheat varieties can lose up to 65 per cent of their yield.
Neil Robinson, USQ research fellow in crop nematology, says tolerance to P. thornei is determined by growing wheat varieties in a field with high, uniform pre-sowing population density of P. thornei. “At season’s end, grain yield is used as a tolerance predictor: varieties that do not lose yield are considered tolerant,” he says.
Through the National Variety Trials (NVT), Mr Robinson’s team use grain yields to classify varieties for their tolerance level and report this to growers. Traditionally, tolerance is assessed by looking for symptoms of P. thornei damage, including lower leaf yellowing, reduced tillering or poor canopy closure.
During the season, visual scores are normally performed twice during stem elongation. “Plots are scored on a one (very intolerant) to nine (tolerant) scaling. This vegetative tolerance rating can be conducted in small plots for plant breeding purposes.
“These same changes in the crop canopy can also be detected by NDVI. We tested if the NDVI of wheat varieties grown in fields infested with P. thornei is predictive of yield and visual scores of plant health, and hence tolerance to P. thornei.”
Experiments
Three experiments were undertaken at a dedicated field site for P. thornei research on Queensland’s Darling Downs using a hand-held Greenseeker™ to measure NDVI.
Mr Robinson says each trial had two stages. In the first year, a resistant and susceptible wheat was grown to establish low or high P. thornei population densities. In the second year, 36 wheat varieties were grown on these treatments.
Visual assessments and NDVI measurements were taken during the season, while grain yield was measured at harvest.
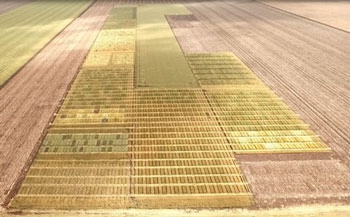 The University of Southern Queensland manages a 20-hectare site dedicated to Pratylenchus thornei research at Formartin, near Jondaryan on the Darling Downs, Queensland. Photo: Adam Quade (QDAF)
Mr Robinson says this research showed that NDVI measurements were predictive of grain yield, and therefore tolerance, which was influenced by initial P. thornei population densities.
The results open up opportunities for those less skilled in visual assessment to use NDVI tools for more efficient selection of P. thornei tolerant varieties.
“The major benefit of NDVI is that it is a quantitative measure. It is not influenced by operator perception or experience.”
Additionally, an NDVI measurement provides crop data before plots are harvested for their grain yield. This is a huge benefit in a region that can be hit by a dry finish, frost or damaging summer storms. “We don’t want to lose trials, so if we had early season NDVI data, it would reduce the risk of losing field trials to extreme weather events.”
NDVI is also being assessed for use on small plots that are not harvested for yield but are visually scored. “Small plots are not designed to be harvested, so we are evaluating if NDVI could provide a less-subjective selection tool for this purpose.”
Mr Robinson says that in the future, there are also opportunities to use unmanned aerial vehicles (UAVs) to collect data. “UAVs could be fitted with NDVI tools to improve data acquisition and phenotyping efficiency. Collecting data would become more efficient and the number of lines that could be screened could be increased.”
Other lessons
With results showing that high population densities, compared to low populations, improve the accuracy of visual scores and NDVI, there are other potential ramifications for future experiments.
“A single measurement at approximately early boot development stage on these high P. thornei populations would be a satisfactory measure of tolerance.”
NDVI measurements from high population densities also helped researchers learn more about how varieties react to P. thornei. “We were able to demonstrate that intolerant varieties lost their ‘greenness’ quickly, with NDVI decreasing from as early as 40 to 60 days after sowing (see Figure 1).
“Intolerant plants are unable to use the available soil water and nutrients like their tolerant counterparts and suffer with lower leaf chlorosis and reduced biomass, resulting in reduced yields.”

Neil Robinson, research fellow in crop nematology at USQ’s Centre for Crop Health, says the area between the two lines is an important measure of tolerance. “The greater the area, the more intolerant the variety - the tolerant ones have very little separation.” Source: Robinson et al. 2019 Tolerance of wheat cultivars to root lesion nematode (Pratylenchus thornei) assessed by normalised difference vegetation index (NDVI) is predictive of grain yield, Annals of Applied Biology, vol. 174, pp. 388-401
National Variety Trials
USQ is also funded by the GRDC through the NVT to evaluate major broadacre crops for both RLN resistance and tolerance. This project, and the team at the Centre for Crop Health, are further supported from USQ and the Department of Agriculture and Fisheries, Queensland via the Broadacre Cropping Initiative.
Jason Sheedy, research fellow in crop nematology at USQ’s Centre for Crop Health, explains that resistance is quite different to tolerance. Resistance is the ability of a variety to impede RLN reproduction. “It is measured on a single plant grown in replicated experiments in a temperature-controlled glasshouse at our new Agricultural Science and Engineering precinct in Toowoomba.”
(The $16m precinct was officially opened in February 2019, co-funded by the GRDC and USQ, with additional support from the Department of Agriculture and Fisheries, Queensland.)
Both tolerance and resistance are important traits to be included in varieties in the northern region, Mr Sheedy says. “Firstly, tolerance is key to avoid yield losses. And secondly, resistance is important in minimising population increases and avoiding damaging thresholds that cause yield losses to the current and subsequent crops.”
There are a range of tolerance and resistance levels within broadacre crops, he says. “It is also important to state that a variety may be resistant or tolerant to P. thornei but not P. neglectus, or vice-versa. It is advisable to know the species of RLN present in paddocks when making varietal or cropping decisions.”
Mr Sheedy says wheat, barley and chickpea varieties are tested under the NVT system in field trials for tolerance to P. thornei and P. neglectus. A broader range of crops – wheat, barley, oats, chickpeas, faba beans and field peas – are tested in glasshouse experiments for resistance to P. thornei and P. neglectus.
The results from these experiments and trials can be found at NVT online and in the winter crop sowing guides in the northern region.
The Centre for Crop Health is a research centre of the Institute for Life Sciences and the Environment at the University of Southern Queensland, supported by the Queensland Department of Agriculture and Fisheries.
More information: Neil Robinson, Neil.Robinson@usq.edu.au, 07 4631 1193; Jason Sheedy, Jason.Sheedy@usq.edu.au, 07 4631 1185