


Key points
- A faba bean/canola/wheat rotation was $170 per hectare more profitable at Urana, New South Wales, than barley/canola/wheat
- A faba bean/canola/wheat rotation was $70/ha more profitable at Greenethorpe, NSW, than wheat/canola/wheat
- Success with faba beans depends on fixing subsurface acidity constraints and using tillage to mix lime and soil to the depth of the acid throttle
Trials investigating the effects of adding faba beans to canola/wheat rotations have shown a clear profitability lift in southern New South Wales.
At Urana, adding faba beans to a canola/wheat rotation delivered a $170-per-hectare gain, while at Greenethorpe, a faba bean/canola/wheat rotation was $70/ha more profitable than wheat/canola/wheat.
These are the latest findings from long-term farming systems research led by CSIRO and the NSW Department of Primary Industries (DPI) with GRDC co-investment.
NSW DPI research officer Mat Dunn outlined the financial and agronomic benefits of faba beans at a workshop in March at Ganmain, NSW.
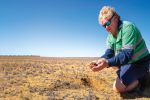
 NSW Department of Primary Industries research officer Mat Dunn spoke to more than 75 NSW growers and agronomists at Ganmain in March about the benefits of faba beans in farming systems. Photo: Nicole Baxter
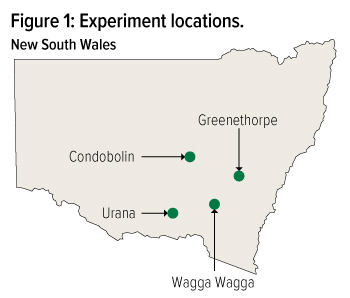
The southern NSW farming systems research project, now in its seventh year, has experimental sites at Wagga Wagga, Condobolin, Greenethorpe and Urana (Figure 1).
 Trial locations
CSIRO and NSW DPI researchers are exploring how to convert rainfall into profit across entire cropping sequences while managing soil fertility, weeds, disease and costs.
Experimental farming systems are compared against a baseline of barley/canola/wheat or wheat/canola/wheat (Table 1).
Table 1: Farming systems for comparison.
| Treatment | Crop sequence | Nitrogen strategy | Sowing time |
|---|---|---|---|
| Baseline | Barley/canola/wheat | Decile 2 (about 75kg/ha of nitrogen or Decile 7 (about 130kg/ha of nitrogen) | Early or timely |
| Intense baseline | Canola/wheat | Decile 2 (about 75kg/ha of nitrogen or Decile 7 (about 130kg/ha of nitrogen) | Early or timely |
| Diverse low-value | (Faba beans or lupins)/canola/wheat | Decile 2 (about 75kg/ha of nitrogen or Decile 7 (about 130kg/ha of nitrogen) | Early or timely |
| Diverse high-value | (Lentils or chickpeas)/canola/wheat | Decile 2 (about 75kg/ha of nitrogen or Decile 7 (about 130kg/ha of nitrogen) | Early or timely |
| Diverse (mix) | Vetch/canola/wheat | Decile 2 (about 75kg/ha of nitrogen or Decile 7 (about 130kg/ha of nitrogen) | Early or timely |
| Fallow | Fallow/canola/wheat | Decile 2 (about 75kg/ha of nitrogen or Decile 7 (about 130kg/ha of nitrogen) | Early or timely |
Source: Mat Dunn, NSW DPI
Each year, the researchers assess the effects of different legumes, nitrogen strategies and sowing times on profit.
While the latest results showed the faba bean/canola/wheat sequence was $170/ha more profitable at Urana and $70/ha more profitable at Greenethorpe, this was not the case at Wagga Wagga and Condobolin, where lupins were grown (Table 2).
Table 2: System gross margin ($/ha/year) for four NSW locations.
| Location | Baseline (barley/canola/wheat) | Diverse low-value (faba beans or lupins/canola/wheat) | |
|---|---|---|---|
| Condobolin | $780 | $730 | -$50 |
| Urana | $820 | $990 | +$170 |
| Wagga Wagga | $900 | $800 | -$100 |
| Greenethorpe | $1110 | $1180 | +70 |
Source: Mat Dunn, NSW DPI
Mr Dunn said that growers must manage subsurface acidity to maximise the range of crop species that can be grown.
“Soil samples collected in five-centimetre increments at the Wagga Wagga trial site revealed an acid throttle,” he said.
“To address this constraint, we applied 3 tonnes per hectare of superfine lime and incorporated it using a heavy cultivator for deep tillage – a Horsch Tiger MT – donated for several hours to the farming systems project by Intersales Wagga Wagga.”
The aim was to achieve soil and lime mixing in the acidic layer, 10 to 20cm below the surface.
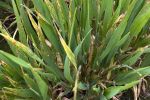
Mr Dunn said faba beans were sown at Wagga Wagga and Condobolin earlier this year to explore their effects on soil nitrogen, weeds, disease, income and costs.
While the soil pHCa at Condobolin was not as acidic as the Wagga Wagga site, he said superfine lime was spread and incorporated using a heavy cultivator for deep tillage – a K-Line Ag SpeedChisel® – donated for several hours to the farming systems project by Forbes Machinery Centre.
Nitrogen after legumes
When exploring the legacy effects of legumes on nitrogen, Mr Dunn said the results showed an extra 48 kilograms/ha of mineral nitrogen was available for the canola crop at Urana, and 98kg/ha of extra mineral nitrogen was available at Greenethorpe (Table 3).
Table 3: Nitrogen (kg/ha) available in the soil after faba beans at Urana and Greenethorpe, NSW.
| Crop sequence | Urana | Greenethorpe |
|---|---|---|
| Mineralisation over summer before sowing canola (kg/ha of nitrogen) | Mineralisation over summer before sowing canola (kg/ha of nitrogen) | |
| Barley or wheat/canola/wheat | 21 | 105 |
| Faba beans/canola/wheat | 57 | 149 |
| Mineral nitrogen in the soil before sowing canola (kg/ha of nitrogen) | Mineral nitrogen in the soil before sowing canola (kg/ha of nitrogen) | |
| Barley or wheat/canola/wheat | 57 | 136 |
| Faba beans/canola/wheat | 105 | 234 |
Source: Mat Dunn, NSW DPI
Accordingly, adding faba beans to a canola/wheat rotation reduced the nitrogen applied as urea, on average, by 43kg/ha of nitrogen at Urana and 37kg/ha of nitrogen at Greenethorpe compared with what needed to be applied to the barley/canola/wheat. This reduced the risk of these systems.
Regarding the yield benefits of faba beans to subsequent crops, the researchers discovered a slight (100kg/ha) increase in canola yield when canola followed faba beans rather than wheat at Greenethorpe.
At Urana, canola following faba beans yielded 300kg/ha more grain, on average, than canola following barley (Table 4).
Table 4: What is the grain yield benefi t of faba beans to subsequent crops?
| System | Crop sequence | Average crop yield (t/ha) | Average crop yield (t/ha) | Average crop yield (t/ha) |
|---|---|---|---|---|
| Cereal or pulse | Canola | Wheat | ||
| Greenethorpe | Greenethorpe | Greenethorpe | ||
| Baseline | Wheat/canola/wheat | 5.1 (wheat) | 3.4 | 5.4 |
| Diverse low-value | Faba beans/ canola/wheat | 4.4 (faba beans) | 3.5 | 5.7 |
| Urana | Urana | Urana | ||
| Baseline | Barley/canola/wheat | 6.2 (barley) | 2.1 | 4.9 |
| Diverse low-value | Faba beans/ canola/wheat | 4.7 (faba beans) | 2.4 | 5.0 |
Source: Mat Dunn, NSW DPI
Gross margins
When faba beans were added to farming systems, significant gross margin differences emerged (Table 5). The results show gross margin differences became significant in the year the canola was grown. At Greenethorpe, on average, canola after faba beans returned $195/ha more than canola after wheat (Table 5).
Table 5: Where does the gross margin1 difference from faba beans arise?
| Mean annual gross margin ($/ha/year) | Mean annual gross margin ($/ha/year) | Mean annual gross margin ($/ha/year) | Mean annual gross margin ($/ha/year) | ||
|---|---|---|---|---|---|
| System | Crop sequence | Mean | Cereal or pulse | Canola | Wheat |
| Greenethorpe | Greenethorpe | Greenethorpe | Greenethorpe | ||
| Baseline | Wheat/canola/wheat | 1108 | 1095 | 1033 | 1195 |
| Diverse low-value | Faba beans/ canola/wheat | 1179 | 1058 | 1128 | 1252 |
| Urana | Urana | Urana | Urana | ||
| Baseline | Barley/canola/wheat | 820 | 1090 | 475 | 885 |
| Diverse low-value | Faba beans/ canola/wheat | 990 | 1300 | 730 | 940 |
1 Gross margins were calculated by subtracting variable costs from gross income, which was calculated by multiplying grain yield with the spot grain price. Variable costs included seed, fertiliser and pesticides; operation costs for sowing, spraying, spreading, harvesting and cartage; levies; insurance; end-point royalties; and fallow management costs. The variable costs were sourced from the annual NSW DPI Winter Crop Variety Guides and South Australia Grains Industry Trust Farm Gross Margin Guides.
Source: Mat Dunn, NSW DPI
At Urana, on average, canola after faba beans returned $210/ha more than the canola after barley.
When the gross margin was calculated for canola, the diverse low-value farming system with faba beans was $255/ha more profitable than the baseline farming system without faba beans (Table 5).
Return on investment
Mr Dunn said farming systems with faba beans at Greenethorpe and Urana had a slightly higher return on investment than wheat/canola/wheat rotations (Table 6).
Table 6: Return on investment.
| System | Sequence | Nitrogen applied (kg/ha of nitrogen/year) | Total costs1 ($/ha/year) | Mean gross margin2 ($/ha/year) | Return on investment3 |
|---|---|---|---|---|---|
| Greenethorpe | Greenethorpe | Greenethorpe | Greenethorpe | ||
| Baseline | Wheat/canola/wheat | 77 | 838 | 1108 | 1.32 |
| Diverse low-value | Faba beans/ canola/wheat | 40 | 852 | 1179 | 1.38 |
| Urana | Urana | Urana | Urana | ||
| Baseline | Barley/canola/wheat | 72 | 732 | 820 | 1.12 |
| Diverse low-value | Faba beans/ canola/wheat | 29 | 717 | 990 | 1.38 |
1 Total costs included seed, fertiliser and pesticides; operation costs for sowing, spraying, spreading, harvesting and cartage; levies; insurance; end-point royalties; and fallow management costs. The variable costs were sourced from the annual NSW DPI Winter Crop Variety Guides and South Australia Grains Industry Trust Farm Gross Margin Guides.
2 Gross margins were calculated by subtracting variable costs from gross income, which was calculated by multiplying grain yield with the spot grain price.
3 Return on investment was calculated by dividing the gross margin by total costs. A higher number suggests a higher return on investment.
Source: Mat Dunn, NSW DPI
At Greenethorpe, the faba bean/canola/wheat rotation was less risky (with lower costs) and more rewarding than the wheat/canola/wheat rotation.
At Urana, growing faba beans also offered a higher reward and less risk (with lower costs) than the barley/canola/wheat rotation.
Crown rot risk
Mr Dunn said the research demonstrated that crop sequences that include a double break (legume followed by canola) can help reduce the crown rot risk.
He pointed to the Urana site as an example, where PREDICTA® B tests showed the disease risk category for crown rot was rated high in March 2018. However, by growing lentils/canola/wheat, PREDICTA® B tests showed the crown rot risk category had reduced to a low rating by March 2021.
In the same period, PREDICTA® B tests showed the crown rot risk category in the canola/wheat rotation had dropped from high to medium, likely due to only one break crop preceding the wheat crop.
By contrast, PREDICTA® B tests showed the crown rot risk in the canola/wheat/barley rotation had increased after three years with enough inoculum to keep it in the high-risk category.
More information: Mat Dunn, mathew.dunn@dpi.nsw.gov.au
Resources
CSIRO Agriculture and Food chief research scientist Dr John Kirkegaard presented similar data at the 2024 GRDC Update at Wagga Wagga.