


Key points
- CSIRO reviewed local, annual and growing season climates and associated sorghum production
- Comparing these results to other production areas, Dr Jeremy Whish and Dr Elizabeth Meier showed that climate change is not yet pushing key production areas further south
- Climate change is reducing sorghum’s yield potential, but there is still room to reduce the yield gap through adapted agronomic practices that counteract this decline
Despite climate change reducing sorghum’s yield potential, it is not yet pushing key production areas further south.
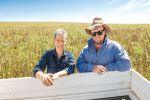
Two CSIRO farming system modellers, Dr Jeremy Whish and Dr Elizabeth Meier, have been examining northern sorghum production in response to climate change’s rainfall and temperature effects.
Dr Whish says a key concern among northern grain growers is that climate change has not only reduced sorghum yields, but it could shift production to areas where the climate is cooler and less variable.
To address these concerns, he and Dr Meier reviewed local, annual and growing-season climates and associated sorghum production and compared these results to other production areas. “We wanted to see how or if things have changed.”
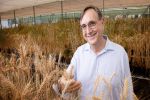
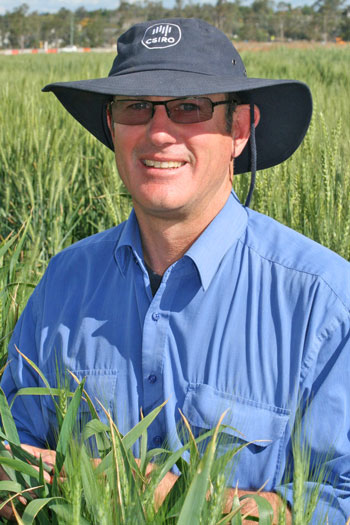 CSIRO farming system modeller Dr Jeremy Whish
In general, there was an overall reduction in yield potential. Although some specific sowing dates at a few sites showed yield increases, due to a shift in the timing of rainfall and extreme temperatures, the current most productive sorghum growing regions remain the same.
However, there is still room to reduce the yield gap in traditionally high-yielding areas. “Good agronomy and the use of robust soil water triggers at sowing will help maintain profitable returns under changing climates,” Dr Whish says.
Climate changes
The work looked at the climate from central Queensland to southern NSW. Dr Whish says the aim was to see: whether the temperature had changed; if so, whether crops had been affected; and how this change could be managed.
Current climate was compared with historical climate using a ‘climate normal’ approach, with 30-year time periods (1958–87 and 1988–2017) examined. A production simulation in response to a range of initial soil water and sowing dates was then done using the Agricultural Production Systems sIMulator (APSIM). This sought to identify whether changing management practices could mitigate the effect of any changes in climate.
The climate results showed that most areas were experiencing reduced rainfall and a continual increase in heat and extreme temperature days. Meanwhile, production results helped to show what effect a changing climate has when planting with a full profile compared to one with less than 100 millimetres.
Figure 1: Research points
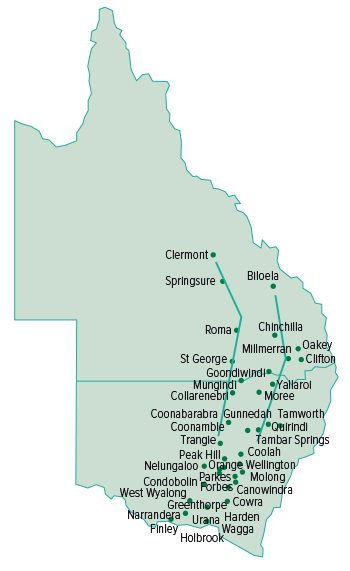
This map shows the two different transects – western and eastern – referred to in the research. Comparing climate and yield data, the work showed the eastern transect’s northern sites had a clear yield reduction. This relates to sites north of Goondiwindi, especially for sowing dates before November. Source: CSIRO
For northern sites on the western transect (from Mungindi north), there was little change in yield, except for a reduction of about 0.5 tonnes per hectare at the extremes of early sowing and late sowing (Figure 2).
However, for the northern sites of the eastern transect there was a different story. There is a clear yield reduction for sites north of Goondiwindi, especially for sowing dates before November.
For the eastern transect, there were distinct groupings of yield change: improved yield between Goondiwindi and Moree for crops sown between November and January, and a decline in yield on the Liverpool Plains that worsened with later sowings and culminated around a mid-December plant.
Figure 2: Eastern and Western transect results for a full profile
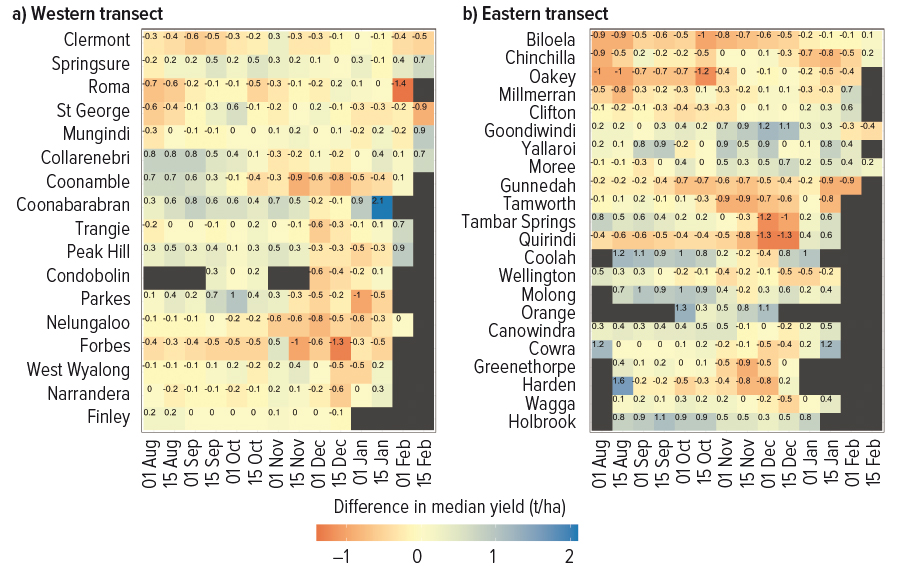
Red shading in cells indicates a decrease in yield, blue indicates an increase, and yellow indicates sowing dates where there was minimal to no difference in crop yield. Only median yields from sowing dates that had fewer than 50 per cent failed crops are included (other location-sowing date combinations were considered unsuitable for crop production and are coloured black). Values within each cell are the difference in yield between the climate normals (t/ha). Source: CSIRO
100mm results
Although it was important to understand whether the most recent 30-year climate normal period was different to the previous, Dr Whish says it was just as important to look at other soil profile amounts.
“It can be inefficient to wait for a full soil profile because producing adequate crops regularly can be more financially rewarding than waiting for ideal conditions to occur.”
So, yields were simulated for crops sown into a profile with an initial available soil water amount of 100mm. “This amount is towards the lower end,” he says. “The general sowing rule for western sites, those west of the Newell highway, is commonly 150mm of plant-available water. In the eastern sites with higher rainfall, 100mm is more common. The 100mm for both transects was a compromise.”
The work showed that there was an increase in crop failures (cells shaded black) between crops sown on a full profile of soil water (Figure 2) and those sown into a profile containing 100mm (Figure 3).
This difference in initial soil water also explains the use of wide row configuration and the 150mm soil water trigger used by many growers along the western transect.
However, despite the yield differences from initial soil water amounts, the general patterns of change between climate normals were the same.
There were minimal yield differences between climate normals for the north-western sites, but a decrease in yield potential for the eastern sites. The November to mid-January sowing dates between Goondiwindi and Moree continued to demonstrate an increase in yield for the more recent normal, while later sowing in the Liverpool Plains continued to demonstrate a yield reduction.
Figure 3: Eastern and Western transect results with 100mm
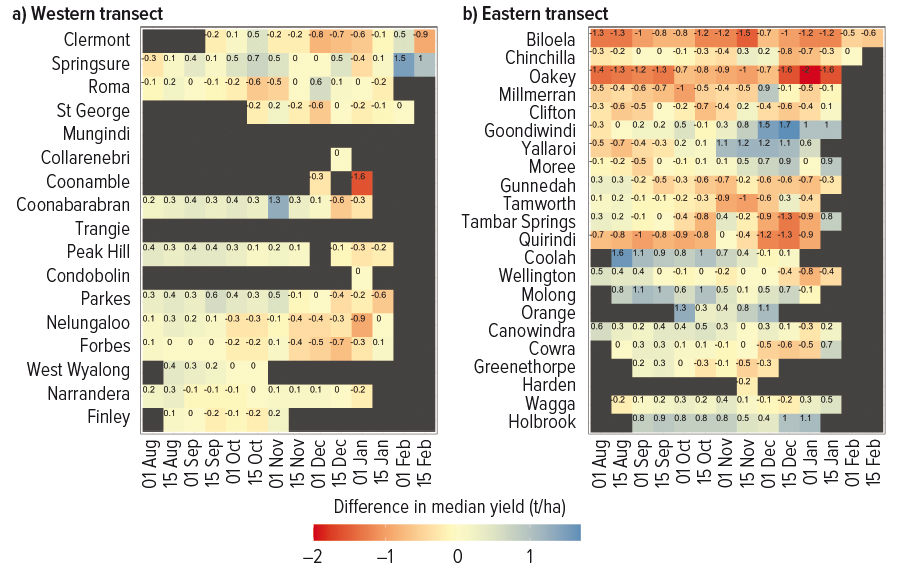
Red shading indicates a decrease in yield, blue shading indicates an increase in yield, and yellow shading indicates sowing dates for each location with minimal to no difference in yield. Only median yields from sowing dates that had fewer than 50 per cent failed crops are included (other location-sowing date combinations were considered unsuitable for crop production and are coloured black). The values within each cell specifies the magnitude of the difference in yield between the climate normal periods (t/ha). Source: CSIRO
What does climate change mean for yields?
Dr Whish says that a changing climate is affecting sorghum production. Higher temperatures increase a crop’s development rate and the amount of water it transpires. “If rainfall remains stable or decreases, then this will increase the chance of moisture stress occurring.”
However, if the crop’s growing period can be matched to the timing of rainfall, then it may be possible to maintain or increase crop grain yield, despite an annual rainfall reduction.
In general, the modelling found that the quantity of in-crop rainfall decreased or remained neutral across locations in both eastern and western transects, although there was an increase in in-crop rainfall at a few locations (Coonabarabran, Goondiwindi and Yallaroi) for some sowing times.
These locations showed an increase in water-limited yield potential and highlight that this increase in rainfall pattern has directly resulted in increased yield.
Yallaroi is one of these sites that has seen an increase in rainfall for crops sown in late October to mid-November over the past 30 years, despite a slight decline in summer rainfall overall.
Figure 4: Differences in median in-crop rainfall for western and eastern transects
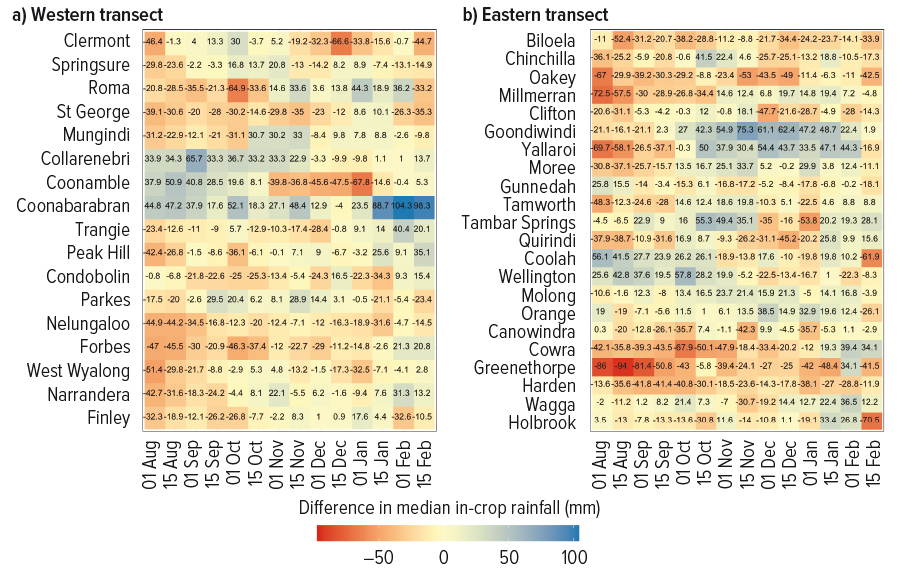
Difference in median in-crop rainfall for the 14 different sowing dates between the two climate periods 1958–87 and 1988–2017, for locations in western and eastern transects. Red shading indicates a decrease in in-crop rainfall, blue shading indicates an increase in rainfall, and yellow indicates sowing dates with minimal to no difference in rainfall between normals. The values within each cell are the difference in median in in-crop rainfall (mm). Source: CSIRO
High temperatures around flowering can significantly reduce sorghum grain yield and is having an effect. The difference in the number of days with temperatures in excess of 35°C increased between the past 30-year climate normal period and the more recent one.
The increase in days with extreme temperatures was greater for the western transect, especially for crops sown between October and November. For the eastern transect, there was a general increase in the number of days with extreme temperatures for all sowing dates before December. However, a few specific sites experienced a reduction in extreme temperatures. These sites and sowing dates correspond with those that experienced an increase in rainfall and consequently an increase in median yield potential (Figure 5).
Figure 5: Differences in the number of hot days during flowering for western and eastern transects
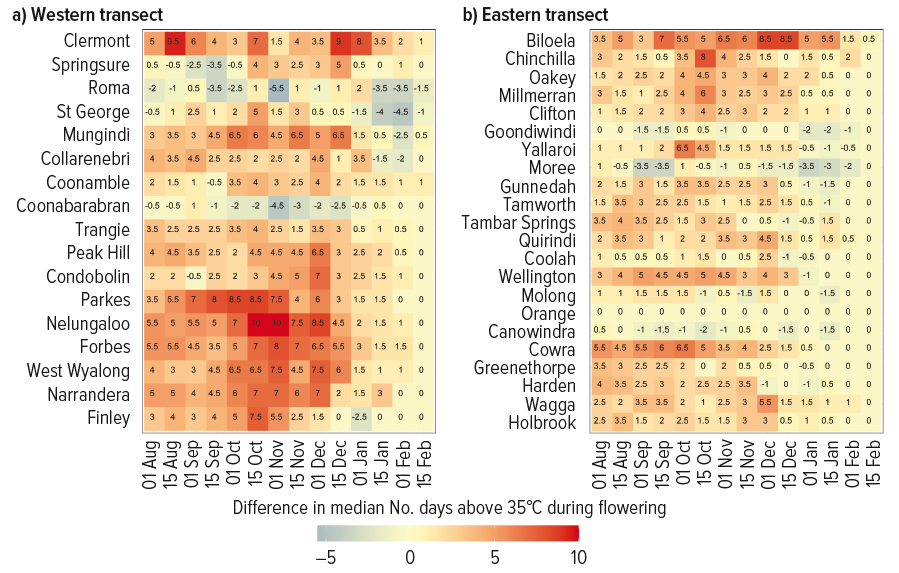
Difference in the median number of days above 35°C during flowering for the 14 different sowing dates between the two time periods of 1958–87 and 1988–2017, for western and eastern transects within the northern grain zone of eastern Australia. Red indicates an increase in rainfall while blue indicates a decrease, and yellow highlights those sowing dates with minimal to no difference. The values within each cell are the difference in median number of days above 35°C during flowering. Source: CSIRO
What do the results show locally?
New South Wales
Yallaroi
Rainfall: a reduction in variability and a slight lowering of the average rainfall over time in both summer and winter rainfall.
Temperature: a continual increase in heat to the most recent climate normal; similar in both summer and winter growing seasons.
Extreme: days above 35°C follow a similar pattern to the heat sum (the mean temperature above 35°C) on an annual basis; extreme temperatures occurred in the summer only.
Mullaley
Rainfall: little change over the study period, with a decline in summer rainfall compensated by a slight increase in winter rainfall.
Temperature: a continual increase in heat to the most recent climate normal (1988–2017), similar in both summer and winter growing seasons.
Extreme: days above 35°C follow a similar pattern to the heat sum on an annual basis; extreme temperatures occurred in the summer only.
Millmerran
Rainfall: an increase in variability and a decline in average rainfall over time; a decline that has occurred in both summer and winter rainfall.
Temperature: a continual increase in heat to the most recent climate normal; a change that is similar in both summer and winter growing seasons.
Extreme: days above 35°C follow a similar pattern to the heat sum on an annual basis; extreme temperatures occurred in the summer only.
Central Queensland
Moura
Rainfall: a significant rainfall decline (P ≤ 0.5) has occurred; with the majority of this decline during the winter season.
Temperature: a continual increase in heat to the most recent climate normal; a change that is similar in both summer and winter growing seasons.
Extreme: days above 35°C follow a similar pattern to the heat sum on an annual basis; extreme temperatures generally occurred in the summer, but the number of days in winter is increasing.
Capella
Rainfall: has had minimal change; however, greater variability is observed in the most recent 30-year period with this variability predominantly in the summer.
Temperature: a continual increase in heat to the 1978–2007 normal and then levelling for the most recent climate normal, 1988–2017. The change in accumulation of heat was similar in both summer and winter growing seasons.
Extreme: days above 35°C follow a similar pattern to the heat sum, increasing to the 1978–2007 normal and then plateauing. Extreme temperatures generally occur in the summer, but the number of days in winter is increasing. The final climate normal temperature and rainfall has greater variability, which supports current climate change predictions.
More information: Dr Jeremy Whish, 07 3214 2448, jeremy.whish@csiro.au