


Key points
An expert on greenhouse gas emissions (GHG) suggests growers:
- learn how to calculate a carbon footprint with an Australian calculator
- assess the options to reduce GHG emissions, including the impacts on profit
- remember that carbon sequestration in soil and trees is often initially higher than long-term sequestration rates and needs to be maintained permanently
Agriculture is unlikely to be immune from a requirement to reduce greenhouse gas emissions (GHG) and growers need to start learning how to calculate a carbon footprint.
This was the message from NSW Department of Primary Industries research scientist Dr Warwick Badgery to the 2024 GRDC Updates in Wagga Wagga.
Dr Badgery said the first step was to establish a GHG emissions baseline and assess the options available to reduce emissions, including any effects on profit.
He said there were government and industry initiatives to create an emissions baseline and plan management changes. In explaining how this relates directly to growers, he said companies that use grain would likely seek to buy grain with lower GHG emissions to meet future emissions reduction targets.
“The Australian grains sector will need to reduce the emissions associated with production to remain competitive in global markets.”
GHG emissions
Dr Badgery also explained that carbon dioxide (CO2), nitrous oxide (N2O) and methane (CH4) contribute differently to global warming.
“The global warming potential or CO2 equivalent (CO2-e) of these gases is given a value for their impact on the environment over a 100-year period,” he said.
“These values have changed over time as the method for estimating the impact of GHG emissions on global warming has been refined.”
In the Intergovernmental Panel for Climate Change (IPCC) Fifth Assessment Report, he said, the global warming potential values for N2O and CH4 are 265 and 28 CO2-e respectively, while CO2 is one.
Baseline emissions
The first step in reducing GHG emissions, he said, was to understand the source of the emissions.
“In Figure 1, 26 per cent of on-farm GHG emissions comes from nitrogen, fertiliser and lime emissions, about 20 per cent from residue emissions (the nitrogen lost from decomposing plant residue) and 11 per cent from fuel use.
Figure 1: Contribution of emissions sources for the Australian grains sector.
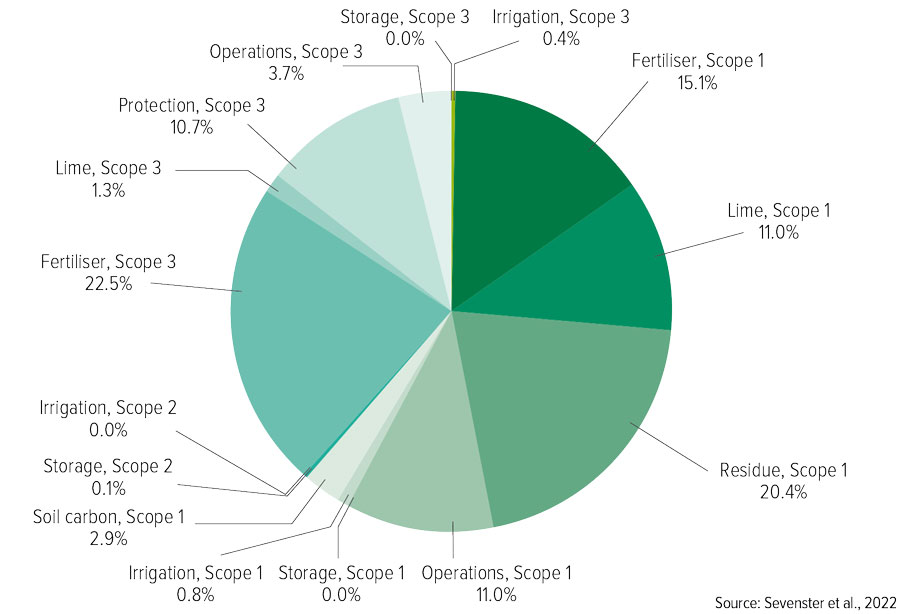
Notes: Scope 1 = direct emissions from a company’s operations; Scope 2 = indirect energy emissions; and Scope 3 = other indirect emissions. The greenhouse gas emissions assessment is for all crops across Australia.
“For off-farm GHG emissions, 22.5 per cent is from fertiliser production and 11 per cent from crop protection chemical production.”
Dr Badgery said these emission sources could be calculated for any given season or year to estimate the total of a paddock, farm or sector.
However, many corporations were looking to use emissions intensity or GHG footprint for a unit of product, not the total emissions, to determine purchases, he said.
“The GHG emission intensity of Australian grain production is 315 kilograms CO2-e/tonne grain, which is low compared to other grain-producing countries.
However, he urged the Australian industry to proactively work towards low GHG emissions intensity to maintain any market advantage.
Dr Badgery said growers could estimate their grains’ GHG emissions intensity using one of the several existing calculators compliant with the Australian greenhouse gas inventory. These include the Cool Farm Tool, available through the Cool Soil Initiative, and PICCC Grains-GAF. (A CSIRO tool called FarmPrint is yet to be commercialised.)
He said a Federal Government-funded training program for GHG accounting would be available through the Grower Group Alliance this year.
Assessing changes
Dr Badgery outlined examples of what to consider when assessing whether management changes to reduce GHG emissions were compatible with for individual farms:
- Check if claims are supported by scientific evidence.
Unrealistic emissions reductions claims and inflated estimates of soil organic carbon sequestration were prevalent, he said.
“The most reliable peer-reviewed information will come from state-based agencies, reputable industry bodies or universities.”
- Prioritise emissions avoidance over carbon sequestration.
Implementing a strategy to avoid emissions (for example, by improving nitrogen use efficiency to reduce nitrous oxide emissions) would reduce GHG emissions.
Sequestration, in soil particularly, was higher risk because it had to be maintained permanently and there was a risk a variable could reverse any gains.
- Potential impacts on productivity.
The most critical consideration is the impact of management changes to reduce GHG emissions on the long-term profitability of the farm business, Dr Badgery said.
“For example, reducing nitrogen inputs can reduce emissions intensity. but also reduce yields and profit and increase reliance on nitrogen mineralised from soil organic matter. This will reduce fertility and lead to soil organic carbon loss."
- Are carbon credits needed?
Carbon credits were not required for a GHG footprint, he said.
“Further, if carbon credits are generated and sold to someone else, they cannot be used to offset emissions within the business, and they may be required to maintain market access in the future.”
- Assess direct and indirect costs.
As well as direct costs associated with management changes to reduce GHG emissions, indirect costs might be more critical to assess (for example, reduced yield from lower nitrogen levels).
Conversely, Dr Badgery noted there could also be indirect benefits such as management changes that facilitated pasture phases improving organic matter, mineral nitrogen supply, and soil physical properties.
"It is important to assess costs on a dollarper-tonne CO2-e basis, also known as the marginal abatement cost," he said.
Table 1 outlines some of the main GHG emission reduction strategies, and the potential for GHG avoidance and sequestration.
Table 1: Summary of management options to avoid greenhouse gas emissions or to sequester carbon in a grain farming system.
| Management strategy | Avoidance | Sequestration | Comments | |||
|---|---|---|---|---|---|---|
| Nitrogen fertiliser efficiency | Yes | Possible | Applying nitrogen fertiliser efficiently (for example, with variable rate, split applications, not in waterlogged conditions) optimises crop yield and replaces nitrogen removal. Excess nitrogen fertiliser above crop removal rates increases the risk of nitrogen losses and nitrous oxide production; higher fertiliser (balanced for nitrogen, phosphorus, potassium and sulfur) could lead to higher soil carbon1. | |||
| Nitrogen fertiliser coating | Yes | No | Using enhanced efficiency fertilisers (for example, nitrogen inhibitors) can reduce nitrous oxide emissions by up to 80 per cent but generally do not increase yield to offset the higher price1,2 | |||
| Nitrogen fertiliser production | Yes | No | Green ammonia1 can reduce Scope 3 emissions from production. Possible modular production available on-farm2. | |||
| Lime use efficiency | Yes | No | Lime neutralises acid soils but also emits carbon dioxide. Improve the efficiency of lime by using precision application. Consider lime alternatives. | |||
Legumes in rotation | Possible | Possible | Legume nitrogen could reduce nitrogen fertiliser needs and the emissions associated with production. Higher nitrogen might also be associated with higher soil carbon. | |||
Biochar | Yes | Yes | Biochar can neutralise soil acidity, reducing the use of lime. It also has a negative priming effect that can stimulate additional soil carbon storage. Currently, it is not viable in extensive grain production systems. | |||
Increasing pasture phases | Yes | Yes | Soil carbon often continues to decrease with cropping, but pasture phases increase soil carbon and nitrogen, and increase nitrogen mineralisation for subsequent crops. | |||
Cover crops and reducing fallows | Uncertain | Uncertain | Legume cover crops could supply additional nitrogen to subsequent crops but also increase the nitrogen fertiliser needs in the short term as nitrogen is used from fallows. Cover crops and reducing fallows might increase soil carbon in some situations. | |||
Revegetation with trees | No | Yes | Revegetation with trees can sequester carbon but removes land used for cropping from production. |
Notes: 1 Further detail on nitrogen strategies to reduce greenhouse gas emissions in: Norton R, Gourley C, Grace P, Kraak J (2024) ‘Securing access to nitrogen for food production, a GHG perspective’. GRDC Updates. 2 Not to be confused with green urea, a coated fertiliser product that reduces nitrous oxide emissions.
Source: Warwick Badgery, NSW Department of Primary Industries.
More information: Warwick Badgery, warwick.badgery@dpi.nsw.gov.au
Acknowledgements
Aaron Simmons, NSW Department of Primary Industries; Richard Eckard, The University of Melbourne; Peter Grace, Queensland University of Technology.
Resources
Dr Warwick Badgery's presentation at the 2024 GRDC Update at Wagga Wagga