


Ground-based electromagnetic (EM) and radiometric surveys are a relatively fast way to map likely soil issues and amelioration options over a large area.
EM surveys measure apparent soil electrical conductivity (ECa), which is an indirect measure of salinity, but also indicative of soil texture and moisture. Higher EM readings could come from more moisture, clay or salts.
In non-saline sandplain and lighter soils, EM is mainly influenced by soil moisture and how deep the clayey subsoil is. Most agricultural surveys use dual-EM, which integrates ECa to depths of 50 centimetres and 1.5 metres.
Radiometrics, or gamma-ray surveys, measure the natural radiation from decaying isotopes in the soil. The isotopes of potassium (K), uranium (U) and thorium (Th) are the most common measured. Given that the radiometrics signal is halved with each 10cm depth increment, it can only be used to measure soil properties to a maximum depth of 40cm. For a more detailed description of EM and radiometrics, see Chapter 4 of The Agronomy Jigsaw.
A survey that measures both EM and radiometrics costs on average $10 to $15 per hectare, without any ground truthing or interpretation, and $25/ha with ground truthing and interpretation. The final cost will vary depending on paddock complexity. A survey will realistically cover about 50ha/hour, running on about 36m transects and collecting data every 5m.
This article presents two case studies using ground-based EM and radiometrics to identify where to undertake soil amelioration.
Case study 1: EM on sandplain soils to map depth to clay subsoil
Where non-wetting soil is a problem, EM can help identify the depth to clayey subsoil to decide whether to clay, spade or delve. If the subsoil is deeper than 50cm, claying is likely to be the best option because the subsoil is too deep for spading or delving. For spading, the subsoil needs to be within 30cm of the surface. For delving, it needs to be within about 50cm of the surface.
Clay spreading to ameliorate non-wetting soil is expensive, with costs ranging from $250/ha for 100t/ha to $1800/ha for 700t/ha of applied clay. Delving costs about $120 to $200/ha, depending on the depth of the clay. As such, mapping where spading/delving is going to work is cheap homework.
Figure 1 shows a shallow (50cm) EM survey on sandplain soils where the lowest EM readings are dark red and the highest EM readings are blue. One interpretation is clay will be deeper in the lowest EM areas, becoming closer to the surface as EM readings increase.
Figure 1a EM map; 1b soil core locations and depth to clay; 1c EM scale showing the number of hectares in each EM reading.
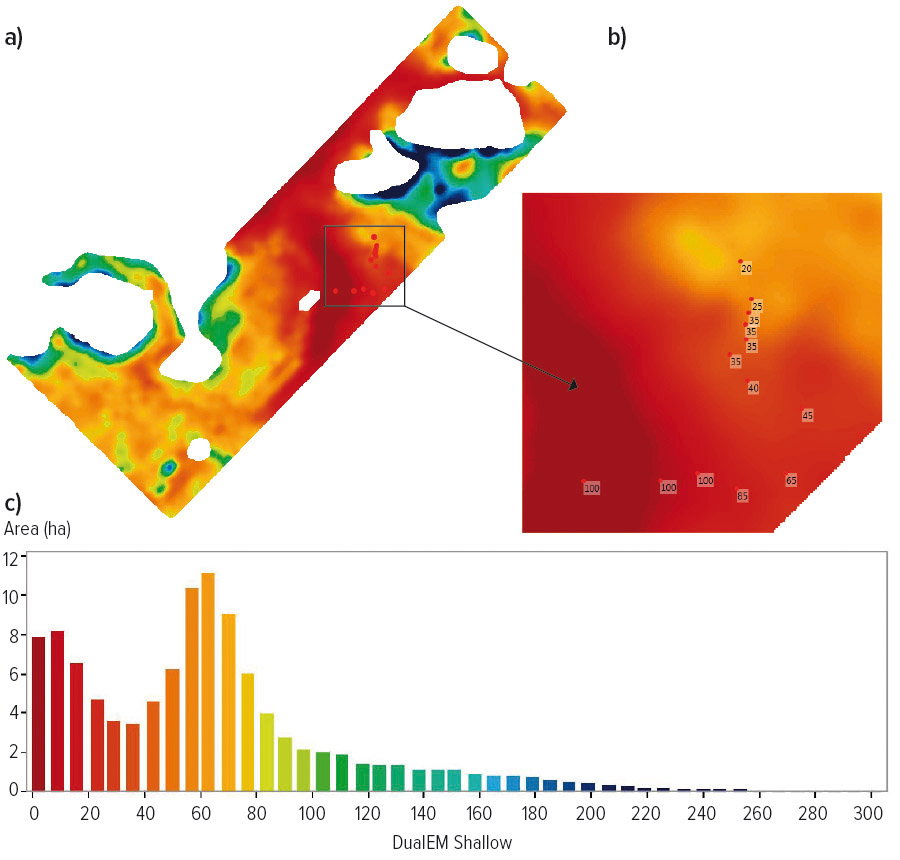
Source: Quenten Knight
There is no universal calibration relating EM to depth to clay. This is because EM values are relative and change from region to region, from farm to farm, and even from paddock to paddock. Absolute values are of little use on their own because a soil property that gives a high EM reading in one paddock could give a comparatively low reading in another.
This means ground truthing and calibrating the EM map to depth of clay is required for each paddock. To ground truth, core or dig holes at a minimum of 10 sites across the range of EM values. Focus on the EM ranges that cover the most hectares i.e. if most of the paddock has an EM value between zero and 40, dig more holes in those areas.
At each site, note depth to clayey subsoil. Collect composite samples to test subsoil quality. Clay with some dispersion is fine as it helps the clay distribute better throughout the topsoil to tackle non-wetting (see Chapter 2 of Spread, Delve, Spade, Invert).
Clays that are too dispersive can form a crust on the surface. If the subsoil is acidic you will need to consider lime as well. If it is high in carbonates it could tie up phosphorus or induce trace element deficiencies. High salinity and/or high boron levels are found in some subsoils – these soils are best left at depth.
The ground truthing cores in this case study covered a transect of EM values from the lowest to about 70. This range was chosen because it:
- covered most of the paddock (see Figure 1c); and
- was the area thought to have the deepest sand and therefore the area most likely to require clay spreading.
In this case, EM values and depth to clayey subsoil were well-correlated. Depth varied markedly, from more than 90cm at the lowest EM values to 20cm at a reading of about 70 (Figure 2).
Figure 2: EM reading and corresponding depth to clay.
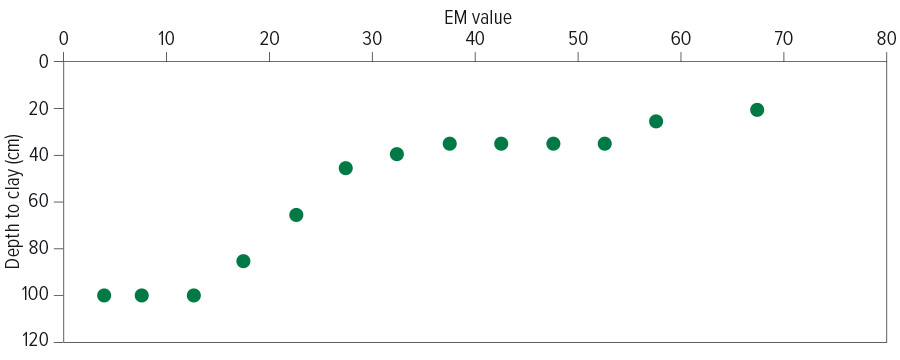
Source: Quenten Knight
Combining the soil core data and EM maps generated Figure 3, showing where to:
- clay spread and spade (red areas; clay more than 50cm);
- delve (yellow areas; clay 30cm to 50cm deep);
- spade (light blue areas; clay less than 30cm deep); and
- do neither (amelioration not needed or not possible).
Figure 3: Final output from combined EM survey and ground truthing.
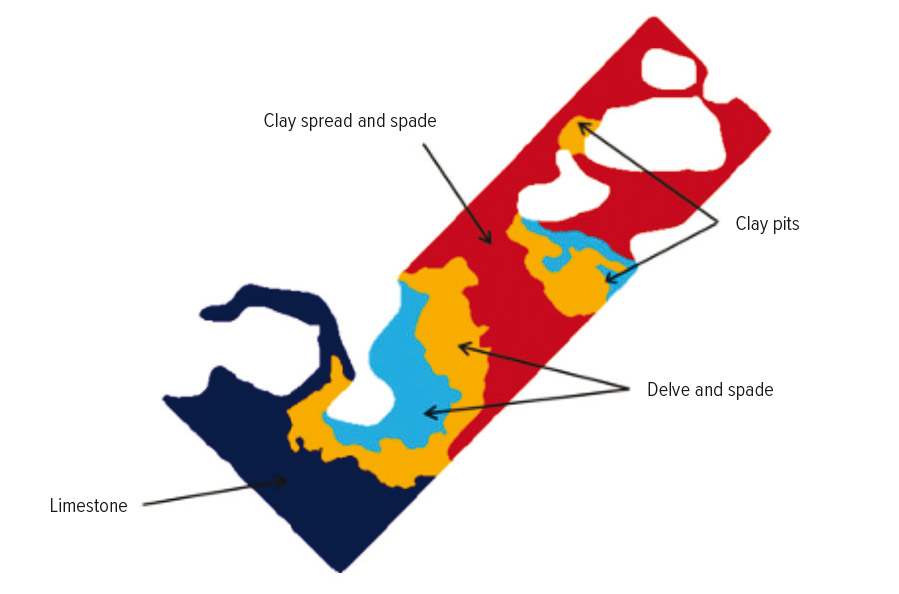
Source: Quenten Knight
Figure 3 highlights just how important ground truthing is. If using the EM map in isolation (Figure 1), the light orange area to the south-west suggests clay is close to the surface and therefore this is a good area to delve or spade. But, if you had decided to go ahead on this information alone, delving/spading would not have been a good investment. This area did not need treating and, even if it did, it was unsuitable because of limestone, clay and rocks. The radiometrics data in Figure 4 shows high levels of thorium (often indicative of gravel) and potassium (often indicative of clay) in the area. In this paddock, high-radiometrics potassium and low EM meant limestone.
Figure 4: Radiometrics thorium (left); radiometrics potassium (right).
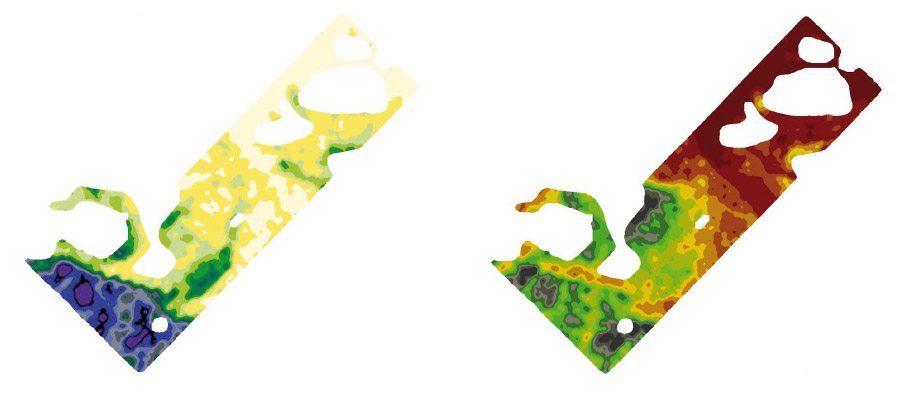
Source: Quenten Knight
Case study 2: Using radiometrics to know where to rip
With ground-based radiometrics surveys, if there is a good correlation between thorium and gravel, a thorium map can be used to target where to deep rip. Because radiometrics work mostly in the top 30 to 40cm, it will help find gravel closer to the surface and map where there might be too much gravel or rocks to rip.
Figure 5 is a thorium map. Lighter-yellow readings are lower thorium values, while dark green, blue and grey are higher thorium values. To ground truth, you could dig a few holes to assess gravel content, or try to rip in representative zones.
Figure 5: Radiometrics thorium map and scale.
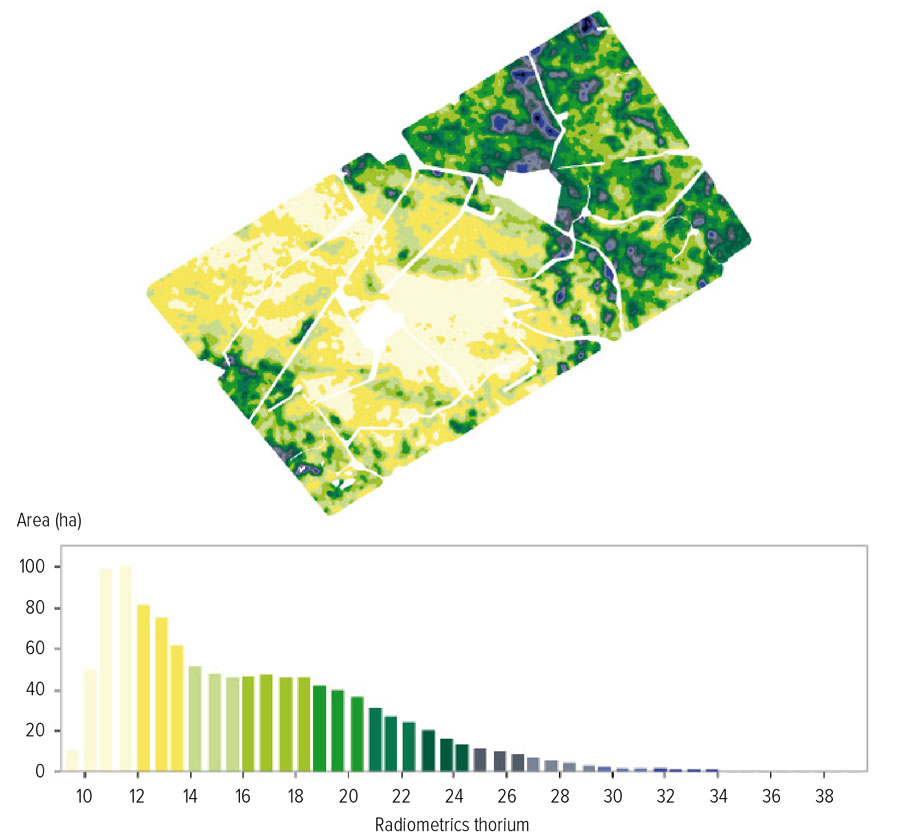
Source: Quenten Knight
In this case, ground truthing showed thorium and gravel content were well-correlated. Lower thorium readings meant lower gravel and these areas were potentially more suited for deep ripping.
Potentially is the key word, as just because an area could be ripped, does not automatically mean it should be ripped. When ground truthing it is imperative to also assess the severity and depth of compaction – this will help decide the best ripping strategy, including machine options and required ripping depth.
The final map (Figure 6) that combined thorium and ground truthing data was divided into two zones. Green zones were sandier soils with negligible gravel/rocks and safe to rip. The red zones were soils with cementic lateritic gravel, and/or too much clay to rip.
Figure 6: Final map combining radiometrics and ground truthing data, showing where it is safe to rip (green) and not safe to rip (red).
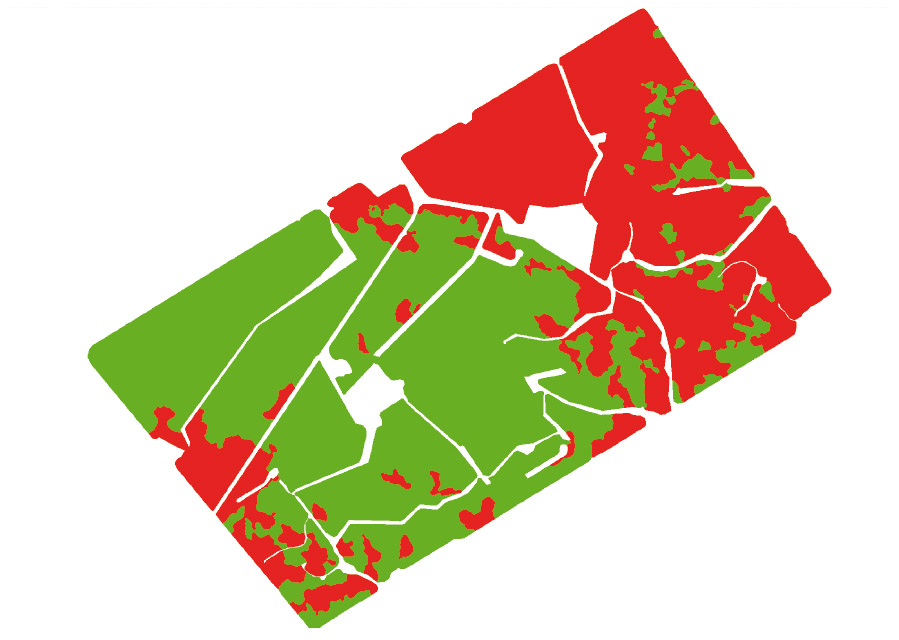
Source: Quenten Knight
Take care with interpretation
Ground-based EM and radiometrics are useful tools but there is a degree of interpolation. Because surveys run on spacings of about 36m, the equipment does not map every square metre of soil. Instead, the software uses the data it collects to estimate soil properties between each survey line. This can result in some small and variable soil areas not being displayed on the maps.
Soil moisture and density at the time of the survey affect readings. For radiometrics, you can get deeper readings from a loose, dry soil than a wet or dense soil. As such, radiometrics surveys are usually better done when the soil is dry. For EM, however, some soil moisture is needed to get readings. Generally, if getting a combined survey, drier is better than wet. EM readings will still pick up soil variability, but readings will be lower than if the soil is measured when wet.
Use EM and radiometrics together
EM and radiometrics are far more powerful combined, as shown in the first case study. If you are getting them both as part of the one survey, make sure they are used together for a more detailed understanding of your paddock. For example, if you find low EM correlates with sand and high EM with clay, overlaying a thorium map can help find sandy soils with high gravel. The project using EM and gamma maps to map soil types and help locate subsoil constraints for management gives some good examples.
Aerial surveys
Aerial radiometrics surveys are useful to look at broadscale soil type or mineralogy changes, but can be too low-resolution to make management decisions on the paddock scale. The free maps from Geoscience Australia, for example, are at 100m resolution, meaning one transect every 100m. That leaves 100m of soil between each pass that needs to be interpolated. Airborne EM is possible, but is expensive and usually reserved for mineral mapping, with transects every six kilometres.
This article was produced as part of the GRDC ‘Maintain the longevity of soils constraints investments and increase grower adoption through extension – western region’ investment (PLT1909-001SAX).
This project is extending practical findings to grain growers from the five-year Soil Constraints – West suite of projects, conducted by the Department of Primary Industries and Regional Development (DPIRD), with GRDC investment.