


Key points
- Growers in the West Midlands region of Western Australia have identified potassium deficiency as a yield impediment on their sandy soils
- This prompted a three-year GRDC investment through the National Grower Network
- While testing of 10 paddocks in the region showed sufficient potassium levels in the crop, not enough was being applied in-season as fertiliser to meet crop needs
- The study highlighted the need for deep soil testing to understand subsoil potassium levels and identified soil compaction at depth as a problem
- The West Midlands Group has developed an infographic in collaboration with growers to present complex information on potassium dynamics
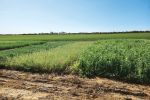
A deep dive into 10 paddocks’ potassium status is helping determine if fertiliser practices are supplying enough potassium for crop growth. Potassium deficiency was identified by growers in the West Midlands region of Western Australia as an ongoing yield limitation on sandy soils.
Potassium is an essential plant macro element. As it can be highly mobile, its availability is influenced by complex interactions between soil chemistry, moisture, soil aeration and oxygen level, soil temperature and the tillage system used.
In response, GRDC has invested through its National Grower Network in a three-year project to understand potassium availability. West Midlands Group (WMG) is leading the project, which began last year.
WMG is also exploring presenting complex data in a practical and informative way to inform growers’ decisions.
CEO Dr Nathan Craig says they designed an infographic with growers to enable a clear presentation of the data involved in soil potassium dynamics (Figure 1). The aim is to assist in decision-making. “The final version of the infographic followed working through several iterations with growers,” Dr Craig says.
“In the centre is a graph of critical potassium levels for the crop (wheat) to understand crop needs at each growth stage. The bottom three graphs show three key soil factors influencing potassium availability: potassium levels, soil moisture content and soil strength at depth for
a particular grower’s paddock.”
At the top of the infographic, the central table summarises crop management factors: target crop yield and crop potassium requirement, and crop potassium status at growth stage 30.
“The infographic is used as a tool, in a single-page report format, to facilitate discussions about soil potassium, soil constraints and on-farm data collection. It allows us to expand our collective understanding of potassium management in an engaged way.”
Figure 1: Soil potassium infographic.

Source: WMG
Methods and findings
For cereals, plant tissue was tested for potassium concentration at growth stage 30. For canola, this was done at stem elongation. Soil samples were taken to a depth of 90 centimetres.
Six soil cores were taken at each site and split into layers 0–10, 10–20, 20–30, 30–50 and 50–90cm. The samples were combined into a composite sample for each layer and analysed by CSBP laboratories (Colwell phosphorus, Colwell potassium and moisture percentage tests). Soil strength was measured using a cone penetrometer. This information created a potassium infographic for each paddock.
The results showed that while seven out of the 10 paddocks had sufficient potassium levels in the crop, there was a deficit between potassium uptake and that being applied.
Dr Craig says not enough in-season fertiliser was applied. “There is a reliance on recycled potassium from throughout the soil profile to ‘make up the difference’ between what was required by the plant and what was available from the soil.”
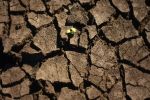
Dr Craig says that hard and compacted soils can hamper deep-soil sampling and root growth, which in turn can affect nutrient-level understanding in those layers. (The critical level for root growth is shown as a dotted red line in the soil strength graph.)
“The very high levels of soil strength at depth also indicates there is compaction requiring some form of amelioration.”
Not surprisingly, seasonal conditions affected soil moisture levels. However, this did not seem to impact crop uptake of potassium.
Nearly all sites showed sufficient status. But Dr Craig says dry conditions can cause nutrient mobility and availability issues.
“In dry seasons, crop response to soil reserves may be restricted as potassium mobility is reduced. This could cause potassium deficiency in very dry years.”
Next steps
Throughout 2024, the project aims to broaden the potassium conversation by setting up trial sites across the West Midlands region and inviting more growers to join in.
These trial sites will investigate fertiliser efficiency, how crop type affects potassium recycling, and deep ripping impacts.
“These developments will inform further improvements to the infographic, which will be reported to growers and GRDC.”
Dr Craig says that future work may include testing for pH. This is another factor that impacts root exploration and potassium availability. “This would build a more detailed picture of potassium dynamics for our region,” he says.
More information: Dr Nathan Craig, ceo@wmgroup.org.au, West Midlands Group