


A diversity of expert skills is vital to the success of the NVT program, and close collaboration with biometricians is essential for generating robust information for growers.
Biometricians bring specialist skills in the application of statistical analysis to biological data, which is critical given that the NVT program operates within a complex biological and environmental context.
It is through the blending of expert minds that a sound biological and environmental framework is agreed upon for the analysis of NVT data.
For the biometricians, NVT is all about the best way of ranking varietal performance in a particular location, so we develop or adopt the current industry best practice to deliver this to growers.
Analytical services are provided for NVT by the biometrics team from the national node of the Statistics for the Australian Grains Industry GRDC investment (SAGI National) at the University of Wollongong (UOW) in New South Wales.
Since 2016, SAGI National has been led by Dr Ky Mathews, supported by Professor Brian Cullis and Dr Alison Smith, both founding biometricians of the SAGI-NVT collaboration. In fact, this long-standing collaboration predates the NVT as the precursor to SAGI.
Run by Professor Cullis and Dr Smith, it was responsible for coordinating statistical analyses across the state-based variety testing systems. SAGI now has grown to four nodes (one national and three regional) spread across Australia.
Replicated small plot trials are the backbone of the NVT program, providing the best means to test varieties under similar conditions as the effect of large-scale field variation is minimised.
Small plot trials, in combination with modern statistical methods, have been well established as the most accurate way of evaluating variety performance.
Quality assurance
SAGI National's services are embedded within the NVT and are multi-faceted.
"We work with trial service providers, NVT managers and breeders to improve their knowledge about statistical concepts, from those fundamental to designing a trial to the interpretation of results for dissemination to industry," Dr Mathews says.
The NVT program evaluates 10 crop species over many different environments spanning our vast continent. Crop performance, therefore, is subject to a wide range of biotic and abiotic stresses, such as pests and disease, droughts, floods and also experimental errors, which vary every year.
"Good data quality assurance is fundamental to minimising the time to delivery on NVT results. In our experience, there are often data quality issues in field trials with many linked to trial management," Dr Mathews says.
These issues are minimised by clear trial protocols and thorough oversight by NVT regional managers.
Data analysis
"For the biometricians, NVT is all about the best way of ranking varietal performance in a particular location, so we develop or adopt the current industry best practice to deliver this to growers," Dr Mathews says.
Information for growers for any crop is obtained from an analysis of 'big data', collated across NVT experiments grown in different locations (providing an exhaustive sample of the entire growing region for the crop) and from at least five consecutive years (providing a comprehensive sample of seasons, excluding sorghum at this time).
This is a large, structured dataset that contains a wealth of information. It is therefore paramount that the analysis of this data, and the reporting of results, respects the investment and the aim of the NVT system; namely, to enable individual growers to choose, with confidence, the best varieties for their particular needs and growing conditions.
Some varieties can be very 'responsive', in the sense that they yield well (rank highly) in some conditions, but may yield quite poorly in others.
This requires a statistical analysis and method of reporting that captures the fact that varieties respond differently (and may therefore rank differently) to changes in growing conditions.
Some varieties can be very 'responsive', in the sense that they yield well (rank highly) in some conditions, but may yield quite poorly in others.
On the other hand, some varieties are very unresponsive (stable) and yield well across a wide range of conditions. In the early days of NVT, the statistical analysis and reporting of results, although state-of-the-art at that time, was too coarse for grower needs.
The analysis only captured variety responsiveness to global changes in conditions, such as represented by years and NVT regions, and variety information was provided accordingly, in the form of long-term regional means.
NVT is the largest coordinated field trial work of its kind in the world, with 650 trials per year. This #GRDCPodcast focuses on accessing and using the wealth of information on the NVT website to make informed variety selection decisions: https://t.co/YVkt6ajxsB || @neale_suttonpic.twitter.com/R6raoBpDGY
— GRDC (@theGRDC) March 20, 2019
More recently, driven by grower and adviser concerns about the relevance of long-term regional means, biometricians at UOW have been using a superior method of analysis developed by Professor Cullis and Dr Smith and used successfully within Australian plant breeding programs for many years.
This analysis captures variety responsiveness at a very specific and repeatable level, and so has the potential to provide growers with the local information they require.
"Implementing these new methods in NVT to provide better information to growers is something I'm very proud of," Dr Mathews says.
"As real-world biometricians who are informed by our stakeholders and context of industries with which we work, we are always striving to improve, and there are some exciting ideas brewing at UOW which we anticipate will improve growers' and advisers' ability to make even better variety selection decisions."
Information delivery
Yield has been the top priority for NVT analysis, but quality measures, disease and pest responses, and varietal descriptions complement this information to aid growers' decisions.
Over the years, the way in which the data has been communicated has also evolved and is in an interactive format on NVT Online, where users can customise their varietal and environment enquiries. This web resource is complemented by static state sowing guides published each spring.
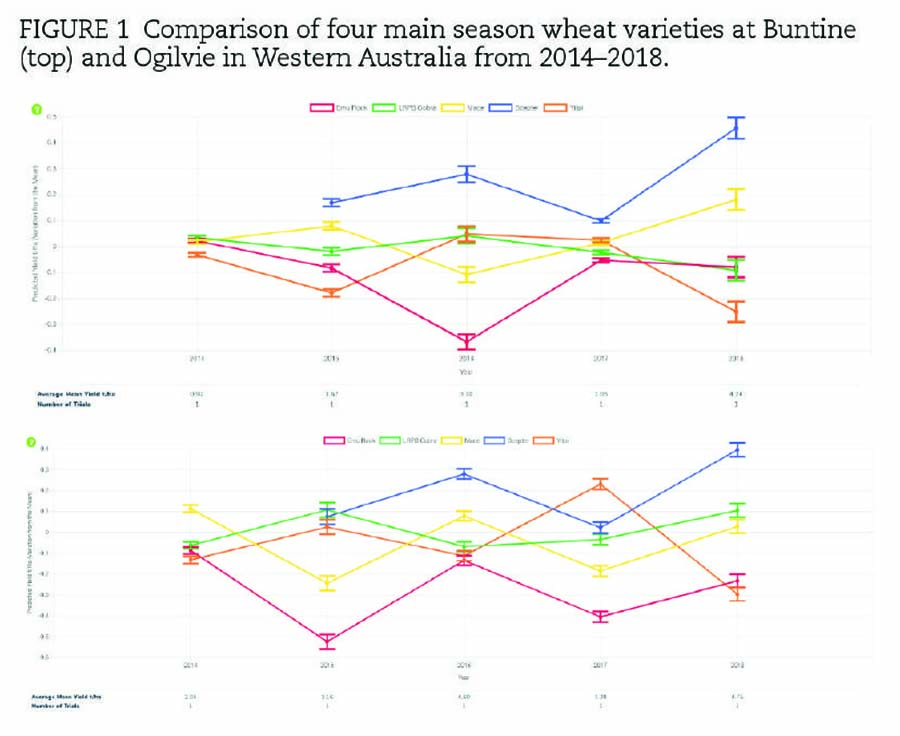
Using the reporting tool available on NVT Online, yield comparisons are presented as 'predicted yield' for each variety in each environment, expressed as a tonnes-per-hectare variation from the mean yield. They are shown as positive or negative differences relative to a baseline, which reflects the expected average yield of all varieties in the user-specified dataset.
The horizontal axis is in year order with the environment (location-year) mean yield (t/ha) shown to provide a reference of the growing season experienced in a year at this location. The bars attached to individual points are standard error bars.
Predicted yields only show where a variety was grown; for example, Scepter (PBR) was not grown at Ogilvie or Buntine in 2014. It is recommended to use these plots to investigate the comparative performance of varieties at an environment.
For example, Figure 1 compares the performance of main season wheat varieties at two locations; in 2018 at Buntine, Emu Rock (PBR) and LRPB Cobra (PBR) performed similarly to each other, yet approximately 0.25t/ha less than Mace (PBR), while at Ogilvie in 2018, LRPB Cobra (PBR) yielded more than Mace (PBR) and Mace (PBR) more than Emu Rock (PBR).
Computer and human capacity
Fast and flexible state-of-the-art software is fundamental to process data and to rollout new statistical methodologies for SAGI National's analyses. What is important, however, is the human capacity to develop such software. Like many key areas in R&D, human capacity in statistics and statistical computing is limited.
"GRDC understood this in the 1990s, resulting in the original and continuing investment in our software tool, ASReml, which was developed by Robin Thompson, Brian Cullis and Arthur Gilmour, to the present day investment in efficient statistical software capable of tackling complex and large datasets at UOW. ASReml underpins the analysis of all SAGI investments," Dr Mathews says.
Yield has been the top priority for NVT analysis, but quality measures, disease and pest responses, and varietal descriptions complement this information to aid growers' decisions.
SAGI National also benefits from being based at a university that has ready access to applied statistical students.
"Being able to work with such a unique industry dataset gives us the opportunity to build capacity for the industry," Dr Mathews says.
Crop variety evaluation is complex and the ongoing close collaboration between biometricians and field-based scientists is vital for providing insights about the context of the trials for data interpretation. This will continue to ensure the NVT is agile and responsive and delivers timely information to Australian grain growers.
Key points
- Expert biometricians, who understand the context of the trials, are required to interpret and analyse the complex NVT data
- Statistics is a dynamic science and the analysis of NVT data will evolve as new methods and tools come online. This will enable growers and advisers to make better decisions
More information: Dr Ky Mathews, University of Wollongong, 0407 039 498, kmathews@uow.edu.au