


Key points
- A good season across Queensland’s Darling Downs region is prompting Russell Taylor to rethink variable-rate nitrogen practices
- Russell is considering purchasing a protein monitor to help make variable-rate nitrogen decisions
- Protein monitors enable growers to map the adequacy of nitrogen supply to cereal crops, which can correlate with soil nitrogen levels
- Although nitrogen is a key cost for the Taylors, rainfall remains the farm’s most limiting factor
After a good season, Darling Downs grain growers Russell and Jacqui Taylor are again rethinking their nitrogen inputs.
The Taylors have dabbled in variable-rate nitrogen practices before, but the past five to 10 years have been so dry that the practice has not been very successful, Russell says. “When there is no in-crop rain to move the nitrogen, the plant is effectively sitting in a deficient paddock, no matter how much nitrogen you apply.”
This season, however, rainfall has been about 25 per cent higher than average. It also fell in well-timed and regular amounts across the barley, wheat and chickpeas on their 1900-hecare farm at Warra, north-west of Dalby.
It has prompted the Taylors to consider purchasing a protein monitor to help make variable-rate nitrogen decisions. Although at $25,000 it is a cost Russell would rather do without, he thinks it will help improve nitrogen management decisions.
Used at harvest, on-board grain monitors record the protein levels of crops across paddocks. In cereal crops, these levels show if nitrogen supply was adequate to match moisture-limited yield potential within that season at each location. When combined with yield data, geo-referenced protein data can also provide more-accurate nitrogen removal maps.
Dry seasons
Yet, before tackling nitrogen, Russell says it has been important to concentrate on another issue first – water use efficiency. “Although nitrogen is our biggest input, our biggest limiting factor is water – or lack of it.”
To improve water use efficiency, Russell started using controlled-traffic farming (CTF) and stubble retention practices in the late 1990s.
“Looking back, CTF was one of the easiest and best things we have done,” he says. “Eliminating random tyre tracks, keeping stubble and deep seeding in the optimum planting window all improved our water use efficiency.”
Back then, he had help from a CTF expert with the Queensland Department of Agriculture and Fisheries, Tim Neale. Today, Mr Neale is still part of the Taylors’ farming team, as a precision agriculture (PA) expert with his business DataFarming.
Russell uses DataFarming to process his PA data, including yield maps, soil tests and normalised difference vegetation index (NDVI) satellite data, and to talk through new decisions.
Mr Neale says years of drought or below-average rainfall can stall decisions on where to go next with PA and, specifically, variable-rate nitrogen practices. “I think – like many growers who are going through drought conditions – Russell got to a point where deciding where to go next was difficult. This is where the simplicity of a protein monitor can help. When combined with yield maps, it will tell him how much nitrogen is being taken out by the crops.”
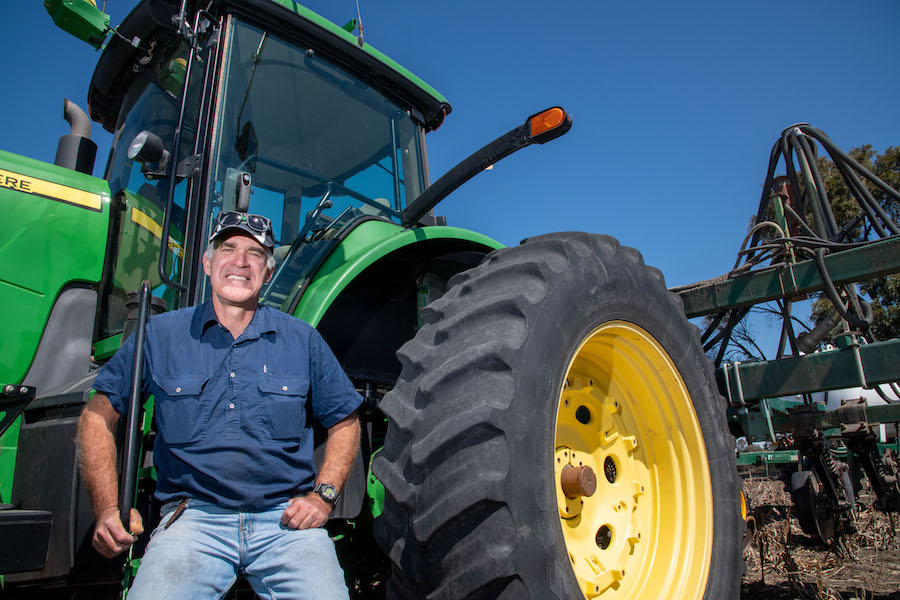
Russell Taylor, with the tractor used to fertilise his crops in Warra on Queensland’s Darling Downs. He is again rethinking a move to variable-rate nitrogen practices on the back of a good season, although water use efficiency remains the number-one goal. Photo: Bev Lacey
Protein monitors
EM Ag Consulting’s Eva Moffitt agrees. She recently completed a research project for FarmLink Research and Precision Agriculture and found that protein monitors offer the potential to develop site-specific strategies that drastically improve nitrogen management (see https://groundcover.grdc.com.au/agronomy/soil-and-nutrition/study-validates-protein-map-soil-nitrogen-link).
Ms Moffitt says protein monitors offer a more-direct correlation to soil nitrogen levels, compared to yield data. “Yield data is important, but low yields might not be related to nitrogen. Similarly, high yields don’t necessarily mean nitrogen supply was adequate, as yield potential may have been even higher. The protein data provides direct insight into the nitrogen status within these zones, which is extremely useful information both for nitrogen management and helping to understand other constraints such as moisture availability.”
She says protein monitors are the most exciting tool she has come across in terms of utility and potential return on investment. “The data is of a much-higher resolution than could be economically feasible with soil testing and can be acted upon in the next season. And, even if you don’t start variable-rate nitrogen practices, you will be more in tune with what you did and what happened during the season.”
In one example from her research, a 100ha paddock would have made an extra $25,000 if nitrogen levels had been optimised to match yield potentials using protein data and soil testing.
“This paddock had recorded low protein levels in 2019 – seven to 11 per cent. In the 2020 trial, we applied a blanket rate of 80 kilograms of urea per hectare and put down some nitrogen-rich strips of 160kg/ha. The yield benefit from the strips was 0.56t/ha. That equated to $141t/ha extra revenue, a gain of $97/ha once the extra urea was accounted for.
“Across the nitrogen-rich strips, we found the greatest return on investment to additional urea occurred in areas where the protein levels were lowest in 2019. In these areas, protein levels of around nine per cent in 2020 showed that nitrogen deficiency was still limiting yield. If we had treated the whole paddock to get to 11.5 per cent protein, we estimate the net benefit would have been around $25,000. And that would have paid for the protein monitor.”
Ms Moffitt says the example is a great anecdote, but not every grower will receive such gains. “In this instance, due to the high yield potential in 2020, the grower would have received the majority of this benefit through simply increasing nitrogen application rates in an overall sense. This comes back to your fundamental nitrogen management practices, including start-of-season deep-nitrogen soil sampling and nitrogen budgeting.”
The protein data served as a powerful evaluation tool to show how much yield was left on the table, she says. “I see huge value in the data for growers and advisers to learn from each season and build confidence and precision in their future nitrogen decisions.
“In terms of using the protein data for site-specific (variable-rate) management, you are more likely to get a better return on investment if you have variable soils or paddocks with different management histories. I’d be more cautious on sandy soils; there is a lot more research still to be done there. The greatest fit is on soils that hold residual nitrogen.”
She suggests talking to your agronomist or existing PA partner about them.
Russell will work with Mr Neale on making sense of his protein results. The plan will not be to reduce nitrogen inputs, but to maximise yield. “What I’m trying to do is bring lower-yielding areas up to an average across the paddock,” Russell says.
He hopes to use yield and protein data to build a more-reliable nitrogen replacement map. “It’s the next step for me. We have tried variable-rate in the past, but it has been so dry that results weren’t great. We have also done some intensive soil testing on our most-variable paddock, but found no major differences in soil characteristics or nutrient levels.”
While he says this was disappointing, it has confirmed his decision to pursue water use efficiency practices. “On one hand, it was disappointing to get this result, but on the other, it confirmed that soil water is our most important factor and we needed to concentrate on that. And, on the other hand, if we hadn’t done the soil testing, we would still be guessing why there were differences.”
Protein monitor ‘rule of thumb’
EM Ag Consulting’s Eva Moffitt says a protein ‘rule of thumb’ can help provide a ‘nitrogen adequacy’ map when using a protein monitor.
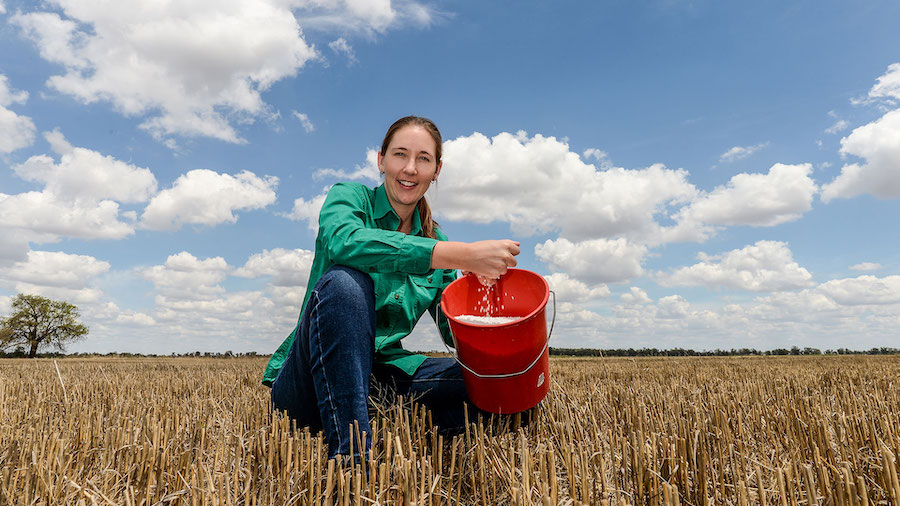
EM Ag Consulting researcher Eva Moffitt. Photo: Nicole Baxter
“For many decades it has been recognised that a consistent relationship exists between cereal grain yield and cereal grain protein concentration according to nitrogen supply.”
While critical grain protein concentrations will vary between varieties and across seasonal conditions, a simplified ‘rule-of-thumb’ interpretation under favourable conditions is:
- protein less than 11.5 per cent = insufficient nitrogen supply to meet yield potential;
- protein 11.5 to 12.5 per cent = adequate/optimum nitrogen supply to achieve yield potential; and
- protein more than 12.5 per cent = surplus nitrogen to crop requirement, possibly some yield penalty.
“If this rule of thumb is applied across a management area grown to a single wheat variety, a geo-referenced map of wheat protein concentration is analogous to a ‘nitrogen adequacy’ map. That is, it serves to distinguish areas of the paddock that had insufficient, ideal or surplus nitrogen according to their site-specific yield potentials.”
More information: Russell Taylor, 0428 999 671, jacrussell2@bigpond.com; Tim Neale, 0409 634 006, tim@datafarming.com.au; Eva Moffitt, 0437 189 025, eva.moffitt@outlook.com