Key points
Steps to apply a big-data approach to on-farm trials
- Visualise paddock data in map format (yield, NDVI, protein, elevation, EM38 etc.) cleaned and interpolated for multi-season comparison
- Analyse patterns of yield within paddock to understand spatial variability, yield stability, probability of exceeding break-even yield, simple profitability analysis and locate strip trials
- Experiment with strip trials designed and located to encompass spatial variability and to understand yield constraints
- Predict return on investment and risk, considering current crop performance and future climate projections
Spatial analysis within a paddock helps to increase the effectiveness of on-farm trials by improving their placement and the subsequent selection of treatment options.
The extent of spatial variability when measuring production performance poses significant challenges for efficient and sustainable crop management.
While precision agriculture tools such as yield maps, variable-rate technology (VRT), remote sensing and data analysis to manage variability are making input decisions more accurate, there remain shortcomings and a need for developing new statistical and analytics tools.
VRT maps are often hand-drawn based on historical yield maps and grower or adviser experience. This can lead to unexpected results owing to the complexity of the intersection between soil, climate and agronomy.
With GRDC support, through Analytics for the Australian Grains Industry (AAGI) and with the Food Agility CRC’s Agri-analytics Hub, researchers at Curtin University’s Centre for Crop and Disease Management are addressing this with NGIS, Farmanco and the Department of Primary Industries and Regional Development.
Researchers have developed spatial analysis tools that can account for the natural variation in a paddock. This has been shown to lift grower confidence in the use of VRT maps, which can be further supported through the generation of meaningful results from paddock-scale strip trials.
Methods
Through a co-design approach, working with growers and their advisers, researchers identify areas within paddocks that are underperforming and then locate and design experiments to understand what is affecting the underperformance.
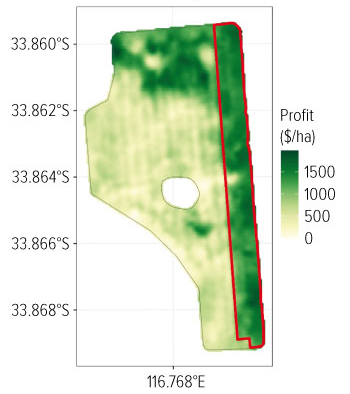
 Figure 1: Map of profit ($/ha) for a wheat crop grown in 2021 following a Plozza plough soil amelioration treatment strip (summer 2019-20) and a canola crop (2020 season) at Qualeup, WA. The treatment strip area runs north to south (outlined in red). Trial conducted by DPIRD (Alice Butler, Bindi Isbister and Gaus Azam).
Researchers begin by visualising yield patterns and categorising them according to performance, using historical yield data and algorithms for data ingestion and interpolation. Through discussions with the grower and their advisers, they co-design an on-farm experimental strip trial in the optimal area of the paddock.
Statistical methods and spatial analysis algorithms are then used to analyse large datasets and predict the crop response and profitability of treatments within the paddock.
The team has developed these methods for fertiliser trials and is now developing them for analysing soil amelioration trials (Figure 1).
These on-farm trials draw on geographically weighted regression analysis to determine spatially varying responses to fertiliser in a map format.
While it has limitations, particularly in areas where crop yields are reaching the maximum, it can otherwise be used to determine which sections of the paddock are responding to fertiliser treatments.
The development of analytical capability and the usefulness of research outputs have been fast-tracked through our co-design approach with growers.
More information: Dr Julia Easton, 08 9266 1727, Julia.easton@curtin.edu.au
foodagility.com/research/agri-analytics-hub
foodagility.com/research/on-farm-experimentation


