Action towards a ‘net-zero’ carbon future is shifting market demand for grain in favour of producers with the lowest greenhouse gas (GHG) emissions.
While this is an emerging situation, the low GHG intensity of Australian canola has already helped growers secure access to the European Union market that are worth $1 billion annually.
To better operate in this low-carbon world, GRDC in 2020 commissioned CSIRO to develop reliable and accurate metrics for Australia's grain production sector.
This accounting exercise had two parts. The first involved calculating a static baseline value based on 2005 emission levels, with 2005 selected to comply with international climate change protocols and standards.
Additional tools were developed to estimate how grain producers have fared since then and to explore various mitigation scenarios to help identify new opportunities for further efficiencies.
CSIRO has now published the findings in a report entitled Australian Grains Baseline and Mitigation Assessment.
The report’s author, Dr Maartje Sevenster, presented the findings at the GRDC Southern Grains Research Update on 8 February 2022.
Grains sector a strong performer
Dr Sevenster told a virtual audience that the 2005 baseline emission intensity for Australian grain amounted to 315 kilograms of emitted carbon dioxide equivalents (CO2e) per tonne of grain produced.
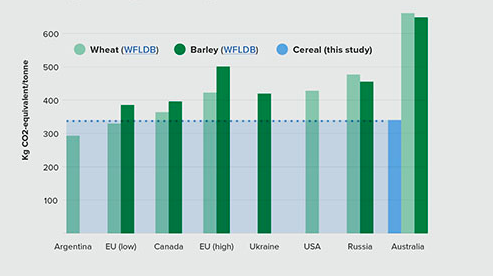
That figure places Australian grain among the most carbon emissions efficient of the big exporting nations. Strikingly, however, the figure differs dramatically to more-generic estimates made by international bodies, such as the World Food LCA Database (WFLDB), shown in Figure 1.
Figure 1: How Australia compares to other grain growing countries using the World Food LCA Database (WFLDB) estimates versus the new CSIRO baseline value that properly accounted for Australian growing conditions and management practices.
Source: CSIRO: Australian Grains Baseline and Mitigation Assessment Report
“The differences we see in the baseline values is due to international estimates that used assessments that are not representative of Australian conditions or farming practices,” Dr Sevenster explained.
With the re-assessment, Australian grain has lower emissions intensity than most of the big producers. Within Australia, grain production accounted for just 1.7 per cent of all of Australia’s 2005-06 national emissions, a low proportion given that grain is Australia’s second-largest agricultural sector and supports a $20 billion annual export industry.
Static baseline
Dr Sevenster explained that the CSIRO project took in all 25 GRDC-leviable crops and accounted for 99.8 per cent of production zones across the country.
“In the National Greenhouse Gas Inventory, grains were not separated from other crops,” she said. “So, we needed a more-specific analysis – for example, digging down to the grain sector’s share of fuel use.”
In keeping with current practices, the analysis broke down GHG emissions according to where in the production system they are emitted:
- Scope 1: emissions that occur on-farm;
- Scope 2: emissions associated with the production of electricity used on farm; and
- Scope 3: emissions associated with other activities outside the farm, such as the production of fertilisers.
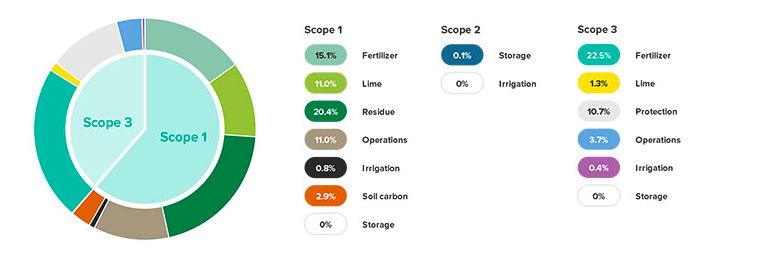
The overall biggest sources of emissions were identified as follows (also see Figure 2):
- 22.5 per cent: Scope 3 fertiliser production;
- 20.4 per cent: Scope 1 emissions associated with decomposition or burning of crop residue;
- 15.1 per cent: Scope 1 use of nitrogen fertiliser;
- 11 per cent: Scope 1 use of lime; and
- 11 per cent: Scope 1 on-farm operations.
Figure 2: Breakdown of grain production GHG emissions by contribution.
Source: CSIRO: Australian Grains Baseline and Mitigation Assessment Report
“Overall, fertiliser accounted for 38 per cent of GHG emissions and is the single-largest contributor,” Dr Sevenster said. “Crop residues also made a large contribution at 20.4 per cent of the total, since nitrogen in the residue behaves like a greenhouse gas.”
However, the way nitrogen is used on-farm is subject to continuous innovation by Australian growers. These improvements were also assessed and accounted for in the second part of the CSIRO analysis (see below).
On the issue of fertiliser, Dr Sevenster noted that ‘green ammonia’ technology that is 100 per cent renewable and carbon-free is likely to bring about further GHG reductions in the future, but not before 2030. That means absolute emission reductions by 2030 are unrealistic.
Dynamic baseline and mitigation
The CSIRO team also developed powerful tools to assess a more-current production scenario (based on the 2015-16 season) and also explore various mitigation scenarios. These analyses took into account the complex interactions between crop biology, management practices and climate using the Agricultural Production Systems sIMulator (APSIM) crop growth model.
The modelling was used to explore the optimum balance between revenue and GHG emissions under various scenarios. Among the mitigation strategies explored were:
- fertiliser application regimes that reflect best management guidelines applied across all production zones;
- fertiliser application regimes that perfectly match crop demand to maximise yield for rainfall conditions to avoid over and under-application;
- alternative crop rotations that vary in their frequency of cereal, legume and oilseed crops relevant to each growing region. These were simulated under the ‘best’ and ‘perfect’ nitrogen management options;
- alternative fertiliser products with reduced GHG footprint; and
- controlled-traffic farming, since improved fuel efficiency of equipment can be directly translated into emission reductions.
The modelling indicated that production can be increased while reducing the associated rate of increase in emission intensity. That translates into increased productivity but at a lower climate cost.
Overall, emission intensity reductions of up to 20 per cent could be possible nationally. Furthermore, green ammonia could drive Scope 3 emissions of fertiliser production down by as much as 50 per cent.
“All scenarios show lower emission intensity for each growing region compared to the 2005 and 2015 baselines,” Dr Sevenster said. “However, there are significant regional differences in how much improvement was predicted.”
The outstanding question is what action based on these scenarios would look like in individual paddocks across Australia’s sub-regions. “To act on these scenarios will first require digging down even more into regional information in order to get the specific optimal practices right,” she said.
The report is available for download.
More information: Maartje Sevenster, GRDC's Greenhouse gas emissions page.
