


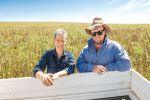


Broden Holland and his family ensure their paddocks have everything needed to support high grain yields on their farm between Young and Grenfell in southern New South Wales.
The 28-year-old – who grows wheat, canola and faba beans across 4400 hectares with his father, Chris – started precision farming in 2016.
Chris went to a Society of Precision Agriculture Australia meeting where he heard about using data from a protein monitor and grid soil sampling to guide inputs.
That year, Broden and Chris bought a protein monitor and fitted it to one of their two harvesters to blend grain according to protein. They also started using two-hectare grid mapping of soil to check pHCa and Colwell-P.
All paddocks now have a Colwell-P level of 55 and a pHCa of 5.5. However, they are now targeting a pHCa of 6.0 to improve faba bean production and nitrogen fixation.
Broden says there is a link between wheat grain protein and plant-available nitrogen.
“It shows how much nitrogen the plant has taken up.”
Since 2017, he has spread urea based on protein maps. Initially, he used six to seven different rates of urea in most paddocks, but he is now back to one or two, where grain protein maps are less variable.
In 2016 and 2017, 1000 tonnes of grain were blended at harvest. But for the past three years, blending has not been required.
“Our wheat grain protein levels are within one per cent,” Broden says. “In the past, we might have seen protein levels varying from eight to 14 per cent.”
Grain yields have also benefited. For example, in favourable seasons, yields on one block have increased from an average of six to 7t/ha of wheat across six per cent of the area to six to 7t/ha of wheat across most of the area.
Broden and his family aim to apply an average rate of urea depending on what the crop needs for that year.
“We then apply urea in 100 kilogram/ha increments based on our protein split over a couple of spreading passes, applying less urea to higher-protein areas and more urea to lower-protein areas,” he says.
“For example, parts of paddocks with 10.5 per cent protein might be given 300kg/ha of urea, while areas of 12.5 per cent protein would be given 100kg/ha if we were targeting 5t/ha yield at 12 per cent protein.”
At first, Broden used a desktop computer running Farm Works software to make variable-rate urea maps. The time required to make a complete set of maps for the farm was up to three hours.
Now, he uses the N-Gauge app, which takes about one hour and can be completed on his phone while on the go.