


Grain losses during harvest represent a direct loss of income for growers. In fact, a recent GRDC-supported Western Australian study revealed more than $300 million of grain was left in paddocks across WA during the 2021 harvest season.
However, agricultural engineer Ben White, who analysed the data from the study, says both harvester capacity and losses need to be optimised. “There is a sweet spot where losses and harvesting capacity balance,” Mr White says.
“It is essential to consider the cost of running a harvester at, say, $500 per hour to calculate the operational cost of harvest. Many variables, including machine outlay and set-up, crop conditions and value, can influence the cost of running a harvester and this needs to be balanced with the cost of grain losses.
To determine the cost of grain losses at harvest, it is vital to measure them both at the front and through the machine, for each crop and each season, using industry benchmarks for guidance.
Industry benchmarks are a useful reference and sit at one per cent of the total yield in cereals and less than two to three per cent for canola. These benchmarks were initially established by the American Society of Agricultural and Biological Engineering and adopted by the wider industry, including manufacturers, engineers, researchers and growers.
WA harvest loss stocktake
Managed by the Grower Group Alliance (GGA) and sampled by officers from the Facey, Stirlings to Coast Farmers and Liebe grower groups, the study collected 200 samples across all five WA port zones, state-wide using Bushel Plus drop trays from 75 sites.
The project aimed to establish baseline measures of harvester grain losses, support growers with machinery decisions to mitigate losses, share insights gained from the project and identify continued research needs.
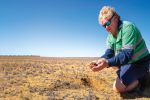
“Visual assessment of grain on the ground does not provide the accuracy needed for informed decisions about machine set-up and setting changes,” Mr White says.
The importance of using trays to determine losses and calibrate loss sensors is critical and this has not been consistently implemented by growers, who are often under time pressures to get crops successfully harvested.
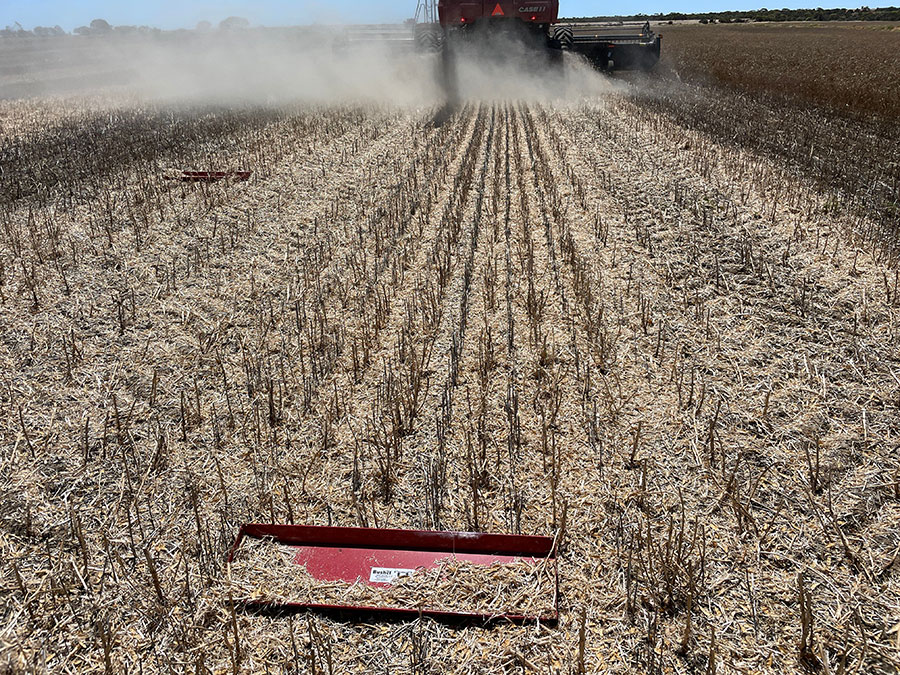
Drop trays should be regularly used each season in every crop to assess harvest losses and assist in adjusting harvester settings to harvest more grain. Source: Grower Group Alliance
Front and machine losses were measured for nine crop species using a number of different harvester brands and front types using a consistent protocol.
Harvest losses were found in all crop species to be greater than the industry benchmarks, indicating that WA growers have an opportunity to reclaim a portion of these (Figure 1).
Average losses in wheat and barley were about two and 4.6 per cent, respectively. Canola losses were measured at 3.2 per cent but as high as 10 per cent. Pulse crop losses were very high, measuring an average of more than 10 per cent in lupins. Most of this was attributable to front losses.
Figure 1: Losses by front and machine by crop types.
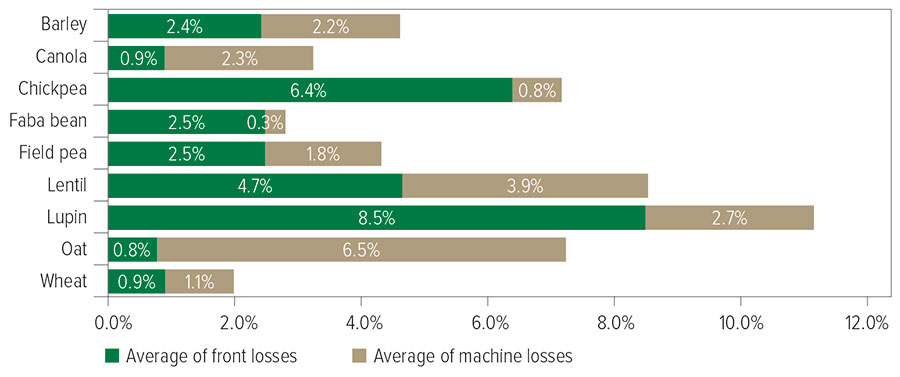
Source: Grower Group Alliance
Front losses in canola averaged 1.7 per cent for growers using draper fronts, while adjustable table fronts averaged losses of one per cent.
“While arguably offering additional throughput and increased field efficiency, average losses measured with stripper fronts are significantly higher than draper fronts in cereals, which growers should consider when calculating the benefits and costs of using a stripper front, for example in a strip and disc system,” Mr White says.
“Investment in an adjustable table front to improve field efficiency may also offer growers significant reductions in losses with canola. Reductions in average losses with an adjustable table front were also observed in barley.
“While lentils are an emerging crop in WA, measured losses indicate a strong case for the use of an air reel to minimise losses.”
Growers using drop trays averaged 1.3 per cent machine losses across all crops, while those not using trays averaged 2.9 per cent machine losses.
Harvest losses were converted to financial losses on a per tonne basis, applying a nominal average price for each commodity for the 2021 harvest. These financial losses are shown by crop species for an average WA grower in Table 1. The data indicates an average WA grower is leaving behind $80,000 worth of grain in the paddock.
Table 1: Losses by value for an ‘average’ WA grower.
| Average of front losses (%) | Average of machine losses (%) | Value of front losses (Av. $ per grower) | Value of machine losses (Av. $ per grower) | |
|---|---|---|---|---|
| Barley | 2.44 | 2.20 | 12,113 | 10,941 |
| Canola | 0.89 | 2.34 | 6,504 | 17,098 |
| Lupins | 8.51 | 2.69 | 5,327 | 1,684 |
| Oats | 0.78 | 6.49 | 419 | 3,502 |
| Wheat | 0.90 | 1.08 | 10,281 | 12,251 |
| TORAL | 34,6413 | $45,477 |
Table 2 shows the average measured capacity of harvesters by crop for the 2021 harvest.
Table 2: Average harvester capacity in tonnes per hour by crop species for the WA 2021 study.
| Crop | Average of capacity (t/ha) |
|---|---|
| Barley | 32.7 |
| Canola | 12.8 |
| Chickpeas | 18.9 |
| Faba beans | 15.7 |
| Field peas | 10.1 |
| Lentils | 9.4 |
| Lupins | 19.8 |
| Oats | 27.6 |
| Wheat | 31.6 |
Harvester capacity and losses need to be balanced in any harvesting operation.
“This is the sweet spot for the most-profitable harvesting. Maximum harvester capacity should be obtained while adhering to losses below one per cent in cereals and between two and three per cent in canola.”
Harvester adjustments
Mr White says losses can usually be reduced to a certain extent by simply going slower, but this has to be done to balance the capacity and cost of harvest.
“Research would suggest losses can be minimised significantly by undertaking adjustments to the standard threshing components while improving harvester capacity. Modifications identified included aftermarket concaves, rotor and threshing element adjustment including rotor offsets, and rasp bar changes.
“A number of apps are available to assist in calculating harvest losses that have other functions, such as the ability to store harvester settings and crop conditions.
Expert advice and assistance can be sought from a harvester technician or by attending the GRDC harvester set-up workshops.
The WA harvest loss study indicates that further work needs to be undertaken to identify additional means of loss reduction during harvest for each crop species.
Information on the measuring harvest losses in WA project is available on the GGA website.
A range of harvest resources, including optimising harvest losses, are available on GRDC’s website.
Advice and assistance can also be sought via the Twitter handle @harvestloss.
More information: Ben White, 0407 941 923, ben@bmwhite.com.au; Measuring Harvester Losses in Western Australia and GRDC harvest resources.