


Key points:
- Investment analysis tools require the use of assumptions and will only be as accurate as those assumptions
- Return-on-asset analysis can provide guidance on buying decisions when thinking about new equipment investment
- Analysing investments using contract rates as the income proxy is a useful diagnostic that removes decision bias
- Total plant, machinery and labour percentages provide an ongoing measure to check the efficiency of plant, machinery and labour across different business models
When it comes to deciding whether to invest in new or second-hand machinery, New South Wales grain grower and former agribusiness consultant Will Martel analyses the ‘return on assets’.
Mr Martel says he uses ‘return on assets before interest’ because it allows the money invested to be compared with the same amount of money invested in the share market or property.
During a GRDC Farm Business Update, he said the higher the return on assets, the more efficient the business is in managing machinery assets to generate profit. “The calculation can be applied across the whole business or to segments of the business or to specific assets in the business.”
Return on assets = Net income ÷ Average total assets
Mr Martel says a negative return on assets indicates the business is depleting its assets, which is not sustainable in the medium to long term.
“Making machinery investment decisions that have a negative return on assets has an impact on the profitability of the business as a whole,” he says. “Although rectifying a health and safety issue would be one reason that a negative return on investment would be accepted.”
Boomspray analysis
During the Update presentation, Mr Martel used the example of buying a self-propelled boomspray valued at $400,000 to show how he calculates return on assets.
Using an Excel spreadsheet he built himself (see Figure 1), he enters the amount of hectares sprayed each year as 6000. This assumes the self-propelled boomspray is used six times a year across 1000ha.
Figure 1: Example return on assets calculation for a self-propelled boomspray.
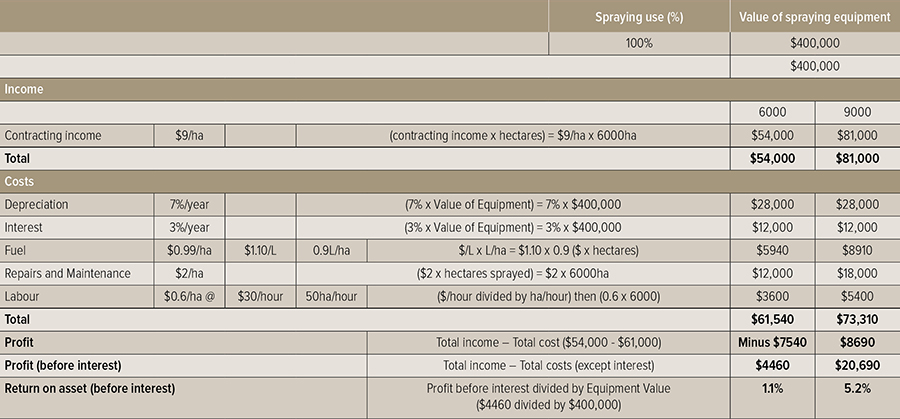
Source: Will Martel, 2020.
For his analysis, he assumes:
- a contracting income of $9/ha;
- depreciation of seven per cent a year;
- interest of three per cent a year;
- fuel costs of $0.99/ha;
- repairs and maintenance of $2/ha; and
- labour costs at $0.60/ha at $30/hour at a rate of 50ha/hour.
When building an Excel spreadsheet for analysing return on assets, he suggested applying a red colour to the cells in the spreadsheet that can be changed. This allows them to be seen easily.
He said individual growers needed to look at the figures in red from their perspective to determine if they are appropriate for the business. “Adjust these figures up and down accordingly,” he said.
In the example of a $400,000 self-propelled boomspray that sprays 6000ha/year, the return on asset is calculated as 1.1 per cent. But for a grower who sprays 9000ha/year, the return on asset before interest would be 5.2 per cent.
Rates and costs
When it comes to putting together the spreadsheet for analysing return on assets, Mr Martel says local contracting rates can be found by word of mouth or a Google search.
For costs, he said it was worth going back through actual figures to work out how much is spent on depreciation, fuel, repairs, maintenance and labour.
“The model shows that the more hectares worked by a piece of equipment over a year, the more chance it will provide a higher return on assets,” he said. “If you’re working more hectares, however, you may need to change the repairs, maintenance and depreciation figures.”
This said, he noted that a self-propelled boomspray may be needed to improve the timeliness of weed control.
“If the model shows you’re losing $10,000 a year on the boomspray, you may decide to absorb that cost because it improves the timeliness of weed control. Or you may wish to contract out your spraying services to make that equipment a viable asset.”
Return on assets
Mr Martel was asked during the Farm Business Update what return on asset growers should be looking for to justify the purchase of a new self-propelled boomspray.
“There’s no specific number, but for my operation I want to do better than alternative investment,” he said. “If I can invest in the share market, for example, and achieve a five per cent return on asset, I’ll want to do better than that.”
He said the greater the return on asset, the better, but there were also assets where a lower return can be justified because they allow for considerations such as timeliness to be met.
Mr Martel was also asked: “when does second-hand machinery stack up as being a better financial and operational decision than buying new equipment?”
“There’s no perfect answer, but I guess if you have a simple model like an Excel spreadsheet, you can easily compare the return on assets by putting in the different values of the machinery,” he said. “Instead of putting in a piece of machinery that is valued at $400,000, you might put in a piece of machinery that is valued at $200,000.”
In this case, he said, the depreciation might be slightly less for used equipment, but interest will be the same. Fuel cost, depending on the size of the machinery, will be more or less the same. The figure for repairs and maintenance is likely to be higher on a piece of used equipment, while labour will be similar, he said.
“If you can buy used machinery that has the same reliability as a new machine, that’s great, but if the used machinery affects timeliness, then you might question that investment.”
He said it was ideal to aim for the timeliness of spraying, sowing and harvesting, but growers needed to make their own decisions about which operation was more important if finances were limited.
“For example, in northern New South Wales and Queensland, harvest timeliness is crucial because the storm season frequently interrupts harvest,” he said. “This is perhaps less crucial in Victoria and South Australia.”
When it comes to planting equipment, he said, spreading out crop and variety choices can help to make the sowing window wider and assist in achieving timeliness.
Planting equipment
Using a similar Excel spreadsheet, he demonstrated what to do when determining the return on asset for a tractor (not used 100 per cent for sowing) and planter (see Figure 2).
Figure 2: Example return on assets calculation for a tractor and air seeder excluding fuel1.
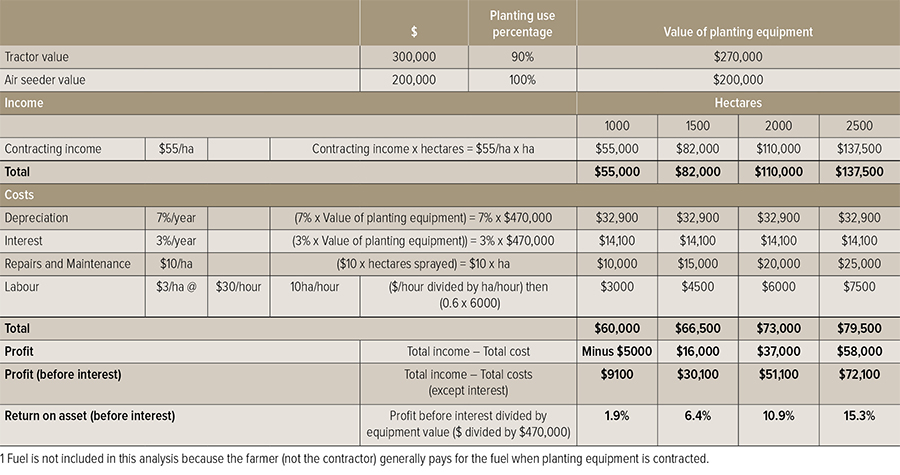
Source: Will Martel, 2020.
In the example, if 1000ha is sown, he said, growers could potentially pick up an additional 500ha of contracting, and the return on asset would go from 1.9 per cent to 6.4 per cent, while profit would be increased by $15,500.
Fuel was not factored into the tractor and airseeder return on asset analysis, he said, because generally in a contract planting operation, the grower (not the contractor) would pay for the fuel.
“When developing a gross margin for a cropping enterprise, I would put the $55/ha cost against the particular crop for planting and also add in a cost for fuel per hectare.”
He said developing a return on assets for various operations such as spraying and planting makes gross margin analysis easier, because the true cost of machinery is factored in. “Sometimes people do not put machinery costs into their gross margins, so they’re not seeing a true gross margin.”
Investment decisions
While it can be tempting to spend money on new equipment when money is in the bank, Mr Martel said it was worth completing a return on asset analysis to determine whether the investment will generate a profitable return for the business.
“Assessing the return on assets will allow you to question, for example, whether it would be better to buy a cheaper piece of equipment or engage contractors, if they are reliable,” he said. “There are a lot of different questions you need to ask before spending the money.”
He said the Excel spreadsheet was also useful to compare if new or used machinery would make more economic sense in different scale businesses. “If you are using the machinery across 15,000ha compared to 6000ha, the depreciation rate will be increased, and you can go through and put that in on your own spreadsheet if you build one.”
Harvest operations
When working out the return on assets for harvesting equipment, he estimated the tractor value at 10 per cent, while the harvester and chaser bin were valued at 100 per cent (see Figure 3).
FIGURE 3: Example return on assets calculation for harvesting equipment.
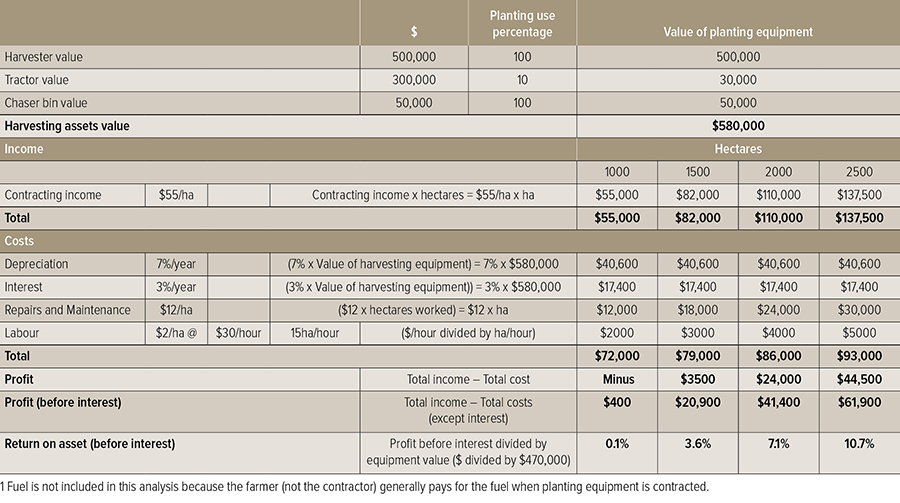
Source: Will Martel, 2020.
“When farm size increases from 1000ha to 2500ha, we move from a loss of $17,000 to a profit of $44,500 and up to a return on asset of 10.7 per cent,” he said.
“If you are looking to fully finance an equipment purchase, it may help to put your numbers into this spreadsheet to show the bank that you are capable of making a decent return on investment.”
During the presentation, Mr Martel was asked why he used a seven per cent depreciation rate.
He said seven per cent was not high enough for a new piece of equipment. “I look at a piece of equipment that I own and say, ‘if it is worth $100,000 today and I use it for 1000ha, how much is it going to be worth in 12 months?’ If it’s worth $10,000 less after 12 months, then the depreciation value is 10 per cent.”
For this example, he said, seven per cent was used. “If that does not look right to you for your equipment, it needs to be changed to whatever is realistic.”
If a machinery purchase shows a low return on asset, Mr Martel said it could still be worth the investment if it improves timeliness.
“In some areas there may not be enough contractors around that can do a job on time for the going rate,” he said. “The spreadsheet analyses a machinery purchase on the basis of pure economics, but you also need to factor in timeliness, cash flow, debt and tax.”
Total costs
During the presentation, agribusiness consultant Jane Foster from ORM said it was worth analysing total plant, machinery and labour (TPML) expenses as a percentage of income to determine how efficiently both were used within the business to generate income.
“What we have done with clients at different times is obtain five years’ worth of financials and review the TPML expense as a five-year average, because we don’t want one great year or poor year to distort the outcome,” she said. “We look at the costs associated with operating the plant, machinery and labour, we might also include unpaid family labour and analyse that as a percentage of income.”
Growers who had TPML expenses that were less than 28 per cent of farm income had achieved a strong result, she said.
“An average result would be to have TPML expenses that are 28 to 54 per cent of farm income. Having TPML expenses that were more than 54 per cent of farm income would indicate these resources were not used efficiently.”
Mr Martel said if growers were spending more than 50 per cent of income on TPML costs, it did not leave much for input costs and profit.
More information: Will Martel, 0427 466 245, whmartel@outlook.com; Jane Foster, 03 5441 6176, admin@orm.com.au