


When South Australian grain grower Barry Mudge looks back on the ‘clangers’ he has made around his enterprise, he can see a flawed decision-making process at play. A result of ‘cognitive biases’, these missteps were influenced by personal preferences, loss aversion or simply stress and fatigue.
The GRDC RiskWi$e project is about avoiding these pitfalls by equipping growers with robust decision-making frameworks. These are intended to help the industry sustain enduring profitability in the face of considerable risks, particularly around weather and price volatility.
“RiskWi$e thinking is understanding variability and thinking about it wisely,” said Mr Mudge, who is part of the RiskWi$e project leadership team. “We are supporting on-farm decision-making by putting in processes and using simple analysis to improve our ability to make more robust choices.”
RiskWi$e has established a network of 26 grower groups to improve the decision-making process by understand possible biases and developing new knowledge to inform uncertainty. Both of these considerations are brought together to maximise reward and minimise downside risk. The GRDC flagship investing is providing $30 million over five years and has engaged CSRIO to coordinate grower nominated areas of study. The RiskWi$e themes include:
- nitrogen, shifting from annualised decisions to a farming systems approach – what risks and rewards in variable soils and climates;
- finance decisions, understanding impacts of large capital purchases to improve future business reliance;
- enterprise agronomic decisions, strategic crop sequences choices to reduce risk from input pricing and maximise returns from higher rainfall seasons;
- managing natural resource capital – risk of investing in deferred benefits where the future return is often uncertain;
- Behavioural science, how personal bias, knowledge, and financial stress impact the quality of decision making.
The nitrogen theme of RiskWi$e, for example, is engaging farming systems groups to explore the risks and rewards associated with different approaches to nitrogen decisions in grain production systems. Some of the important questions being asked include:
- are nitrogen inputs better targeted at the farming systems requirements;
- are nitrogen management decisions really risky; and
- are simple nitrogen decision support tools performing just as well as complex tools.
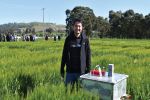
At the 2024 GRDC Adelaide Grains Research Update, Mr Mudge, with collaborator and South Australian Research and Development Institute principal scientist in climate applications Dr Peter Hayman, explained how their Fast Graphs for Slow Thinking tool could be used to inform nitrogen application decisions for both peace of mind and better economic outcomes.
“The value proposition is that there is potentially a five to 10 per cent improvement in bottom-line profits by making better decisions,” said Mr Mudge, who is also a former rural banker with a graduate degree in economics.
“And we’ll see these types of benefits because we’ll hit the ‘sweet spot’ more often. And that is what we are aiming for in this project – getting more right, more often, and avoiding those clangers.”
Personal experience
Inspired by the Daniel Kahneman book Thinking, Fast and Slow, the Fast Graphs for Slow Thinking tool was developed by Dr Hayman and Mr Mudge, who have been collaborating for 20 years on ways to address risk on-farm, particularly in a variable climate.
“As a low-rainfall farmer in Port Germein, I have been trying to understand variability and risk (throughout) my farming career,” Mr Mudge said. “So a relationship developed between myself as the practical farmer and Peter as a scientist, and we just bounce a lot of ideas around.”
One year, coming out of an average season and into an El Nino forecast, Mr Mudge decided to use ‘decision analysis’ – an approach borrowed from applied economics – testing five possible rainfall scenarios to inform his nitrogen decision.
“I applied some probabilities on the outcomes, increasing the chance of receiving lower levels of rainfall, and when I calculated the probability-weighted average, even allowing for an El Nino (that halves the chances of getting higher deciles), the payoff was so large that any rational economic decision was to put nitrogen out, and this is where understanding your rainfall and associated probabilities for seasonal outlook is an important start point,” he said.
If we can understand risk better, it will empower us to make better decisions.
Employing “some clever Excel spreadsheeting”, Dr Hayman then turned Mr Mudge’s analysis model into a spreadsheet – and the Fast Graphs for Slow Thinking tool was born. Now being used by growers to visualise multiple possible futures under different rainfall scenarios, it is helping to underpin decisions about nitrogen use and other agronomic considerations.
While the system might initially appear complex, it required little effort to get results, Mr Mudge said. “We say it takes about 20 minutes to go through the process and enter your data. That’s the ‘fast’ bit and then you can stand back and have a ‘slow’ think about the results.”
A question of nitrogen
When calculating the economic impact of nitrogen using the tool, users enter data such as the rate of urea application, prices of fertiliser and grain, and water and nitrogen limited yields, Mr Mudge said. The spreadsheet then calculates profits or losses based on different rainfall deciles, then provides an average across deciles based on normal expectations.
Inputs into the spreadsheet can then be adjusted to reflect changing climate forecasts throughout a season, with changes in expected returns calculated accordingly.
All this information is displayed in a user-friendly graphic interface that can be understood at a glance. “We can convert the data very simply from the biophysical to the economic at every point and see very clearly a figure related to every decile,” said Dr Hayman.
Mr Mudge said the tool provided valuable analytical support for what were often intuitive decisions. “The spreadsheet provides the opportunity to look at the impact of a range of possible futures – something that is incredibly difficult to do in your head,” he said.
Spreading the word
As part of their role with the RiskWi$e project, Mr Mudge and Dr Hayman have been meeting grower and advisory groups to talk about how to use Fast Graphs for Slow Thinking for nitrogen inputs, as well as other considerations such as crop choice.
These discussions have also revealed the issues that cause growers the most anxiety. Ranging from big strategic decisions to local agronomic concerns, farm expansion topped the list, followed by grain marketing issues. Decisions around nitrogen inputs post-sowing were third.
Mr Mudge said it was critical to identify issues of concern to ensure the RiskWi$e work was appropriately targeted.
“It's about working with farmers, advisers and research partners to make sure we identify the issues important for them,” he said. “These risky decisions are decisions that matter, and finding ways that we can work with growers to allow them to make better decisions more often – to get that five or 10 per cent improvement – is the challenge.”
As growers, it was important to recognise the red flags – the decisions that would either bring reward or regret – to identify when the Fast Graphs for Slow Thinking tool or RiskWi$e approach could provide a more robust way of thinking things through.
“The end point is to have better conversations about risk,” he said. “If we can understand risk better, it will empower us to make better decisions.”