


Research is helping growers disentangle profit drivers for irrigated crops using a framework that examines the effects of markets, irrigation water requirements, crop type, climate, location and farming system on risk and return.
The GRDC-invested project, ‘Optimising farm-scale returns from irrigated grains: maximising dollar return per megalitre of water’, led by the University of Tasmania, is being conducted with irrigation growers across Australia.
The project’s leader, Associate Professor Matthew Harrison, says that for the past three years, researchers have engaged with farmers and advisers throughout the Murray-Darling Basin, from southern Queensland, across NSW and Victoria to the Limestone Coast of South Australia and Midlands of Tasmania.
“The objective is to identify real and perceived problems growers face in improving their returns per unit irrigation water,” Professor Harrison says.
“The project has developed a simple digital tool for growers and advisers, called WaterCan Profit. But we have also conducted more-advanced biophysical and economic analysis to examine the long-term implications of strategic decisions in irrigation, including investment decisions in irrigation infrastructure,” he says.
“We have spoken with farmers to assess why people do or do not invest in new or different irrigation infrastructure.”
Professor Harrison cited the example of Ian Hammond, an irrigated maize grower at Tatura in Victoria, who changed flood irrigation to centre pivot and subsurface drip irrigation about eight years ago. The infrastructure change led to increased water use efficiency with the sprinkler irrigation (centre pivot and drip) compared with flood irrigation: “He also saw slight improvements in maize yields with the sprinkler irrigation, although the difference was small.
“Ian said that, over summer, he would apply around eight megalitres per hectare using flood irrigation, compared with 6ML/ha for the pivot and 5.5 to 6ML /ha for the subsurface drip irrigation system. Similar or higher yields with sprinkler-based systems led to greater water use efficiency (grain produced per unit water applied).”
Mr Hammond reported spending much less on labour, compared with the flood system, but was spending more on the power needed to drive pivot and drip irrigation.
“Overall, the costs are probably much the same but, for me, the labour saving associated with the sprinklers is a big one,” he said.
“I can do it all myself. I don’t have to be out there checking the sprinklers all the time like I do for the flood-based system. I can run the pivot and drip systems over the phone; saving a lot of time and labour.”
Mr Hammond said the pivot and drip systems gave him more watering flexibility: “I can apply 10 millimetres in a single watering event, and I can do it frequently. You don’t have this flexibility with the flood system – it is usually 40 to 50mm in a single watering. So, the sprinklers help me save water and apply more timely irrigation.”
He added that late irrigation (at flowering or after) was more effective with the sprinkler-based systems.
“When it is dry around flowering and the crop needs water, it is easy to apply too much with the flood system and you can’t harvest until the soil is dry. With the sprinklers you can apply the right amount, ensuring you can harvest the crop when it matures, avoiding penalties you might get with grain quality if you harvest too late.”
Adapting irrigation farms
Professor Harrison says that, through engagement with a number of irrigation farmers, the project team quickly realised that there was no ‘one size fits all’.
“Farmers like Ian Hammond choose multiple forms of irrigation infrastructure for multiple reasons. One of these is farm layout. Ian could only irrigate 67 per cent of his farm with centre pivot irrigation (because pivots irrigate a circular area), but with the addition of subsurface drip, he could irrigate nearly 100 per cent of his farm area.”
“Ian also made his decisions based on need for farm labour, technology, cost, paddock layout and crop water requirements.”
To delve further into the financial, agronomic and climate issues that affect farm profit, the researchers explored the impact of four whole-farm agronomic adaptations , as well as four types of irrigation infrastructure on risk (in other words, probability of losing money) and return (financial income):
- The Baseline scenario with flood-irrigated wheat-canola represented the existing case study farm in the Riverina, near Finley in NSW.
- The Intensified adaptation increased the area of the farm under irrigation, applied higher rates of irrigation and nitrogen fertiliser and included summer crops requiring consistent or higher rates of irrigation (cotton, maize and rice). This adaptation was designed to intensify production.
- A Simplified adaptation was also designed. This was the reverse of the Intensifiedsystem, with less area of the farm under irrigation, lower application of water and nitrogen. This adaptation was designed to reduce input costs and risk.
- The Diversified adaptation was designed to increase the number of winter crops in the rotation and included the addition of grain legumes to the rotation.
To improve their understanding of the long-term effects of these adaptations, the researchers conducted the modelling using 30 years of real climate data and prices.
In concert with these whole-farm agronomic adaptations, they explored four types of irrigation infrastructure:
- flood: surface irrigation of bays fed by gravity;
- pipe and riser: surface irrigation supplied by pumps;
- pivot: pressurised irrigation supplied by a centre pivot boom with sprinklers; and
- drip: pressurised irrigation supplied at ground level through tubes in a slow way.
“We have ground-truthed the outcomes of our modelling both with farmers and also experimental field trials conducted in collaboration with Field Applied Research Australia to ensure that the findings are robust and reliable,” Professor Harrison says.
The project team – comprising researchers from the University of Tasmania, CSIRO, the University of Queensland and the South Australian Research and Development Institute − produced a framework that combines soil, climatic, management and economic factors to determine the relative value of each scenario over time.
Adaptation scenarios
Senior research scientist Dr Marta Monjardino says the team compared the 16 adaptation scenarios (four agronomic adaptations by four types of irrigation infrastructure) relevant to irrigated broadacre farms of the Riverina region in Australia.
“The adaptation scenarios were selected from discussions with farmers and industry across the region to represent relevant and contrasting levels of intensity and types of irrigation. We assumed that all adaptations were underpinned by upfront investment in irrigation infrastructure.”
The price for grains, temporary water (mean $138/ML) and fertiliser nitrogen (mean $806/tonne of nitrogen, based on urea at 46 per cent nitrogen) were selected from historical real prices (20 to 30 years) after adjusting for inflation using the consumer price index.
“The long-term profitability of each irrigation scenario was summarised as the net present value (NPV) of future cash flows, or the sum of future net cash flows discounted to their present value. In other words, an irrigation investment is considered viable if NPV is greater than zero, and higher NPV are better than lower NPV,” Dr Monjardino says.
“The difference between the NPV of each adaptation and the NPV of the baseline represents the net value of adaptation, a criterion to compare irrigation scenarios.
“Using economic currency to aggregate contrasting crops and irrigation allocations, we defined a ‘profit gap’ as the difference between the largest net value of all scenarios and the baseline under consideration. We also examined the opportunity cost of trading water − the difference between the return on water sale and the return on water purchased for crop irrigation.
“For the baseline farm, we found a profit gap of about $10 million over 30 years. As shown in Figure 1, whole-farm Intensification – through greater irrigated area, more irrigation, higher nitrogen use and inclusion of summer crops – generally resulted in greater profitability relative to farms with less water-intensive or dryland crops, no cotton and less irrigation. This system also contributed to a lower opportunity cost of trading allocation water.”
Figure 1: Profitability of whole-farm or irrigation infrastructure adaptation (bars) and opportunity cost of trading allocation water (dashed line) for a Riverina farm. Adaptations are ranked by profitability and include: Intensified (blue – greater irrigation area, higher nitrogen use, higher irrigation rates, winter and summer crops); Diversified (green – more winter crop types in the rotation, such as legumes); Current (orange – represents the existing farm system, based on a typical farm in the Riverina); and Simplified (purple – reduced irrigation and nitrogen use, mix of irrigated and dryland crops and lower economic risk). Flood, pivot, pipe and riser and drip represent alternative forms of irrigation infrastructure. The Current system with flood irrigation is the baseline scenario. Opportunity cost is the loss of income incurred by engaging in an adaptation relative to an alternative adaptation. Lower opportunity costs and higher new value are preferred.
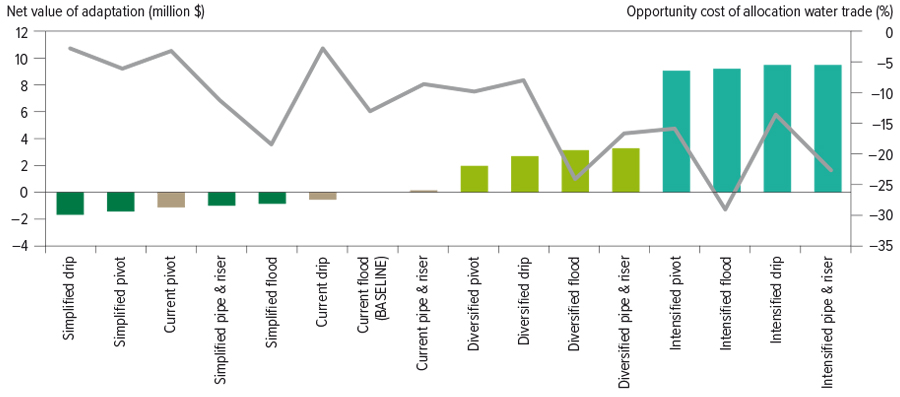
Source: Matthew Harrison
Trade-offs between return and risk
The team showed that adaptations resulting in higher returns also generally had higher economic risk.
“The Intensified adaptation carried greater economic risk, meaning that during bad years the economic loss from such systems could be much higher than for other scenarios,” Dr Monjardino says.
The project team found that the Diversification adaptation – adding more winter crops to a rotation, particularly grain legumes − led to lower economic risk and higher returns per megalitre of irrigation water. They also showed that simplifying the system was a risk-reduction strategy, particularly when water was in short supply.
Investments in surface (flood, pipe and riser) irrigation tended to carry lower economic risk than investments in drip and pivot irrigation (Figure 2).
Figure 2: Risk (light green regions) and profitability (blue regions) associated with whole-farm adaptation and changes in irrigation infrastructure, plotted in thousands of dollars. Adaptations include: Intensified (greater irrigation area, higher nitrogen use, higher irrigation rates, winter and summer crops); Diversified (more winter crop types in the rotation, such as legumes); Current (represents the existing farm system, based on a typical farm in the Riverina); and Simplified (reduced irrigation and nitrogen use, mix of irrigated and dryland crops and lower economic risk). Flood, pivot, pipe and riser and drip represent alternative forms of irrigation infrastructure. The Current system with flood irrigation is the baseline scenario. Higher cash flows and/or lower risk are preferred.
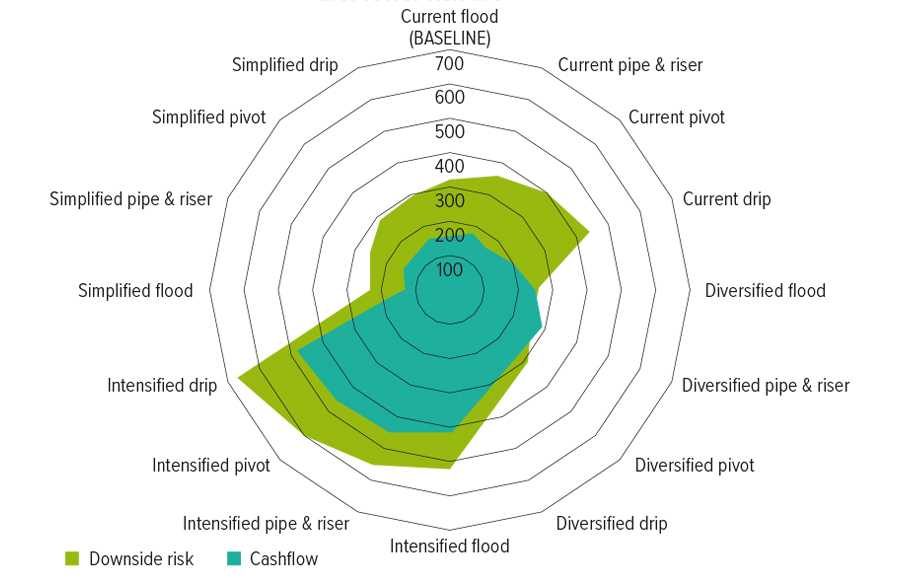
Source: Matthew Harrison
When it comes to irrigation, metrics matter
On a per-megalitre basis, the Diversified and Simplified adaptations resulted in more profit on an annual basis, but on a per-hectare basis, Intensified adaptations were more profitable (Figure 3).
“This highlights the importance of assessing multiple metrics when it comes to crop profitability,” Professor Harrison says. “While you can be profitable with one metric, you might not be profitable in another. In addition to total profit, farmers are encouraged to consider both dollars per megalitre and dollars per hectare when comparing irrigation infrastructure or other changes to irrigation management.”
Importantly, the team found that economic implications of changing between irrigation type (infrastructure) were generally much lower than changing whole-farm agronomic adaptation (for example, to crop type, rotation, irrigation water use).
Other results (not shown here) suggest that significant differences in the cost of risk aversion across scenarios confirm that attitudes to risk are likely to affect irrigation decisions and profit outcomes in riskier contexts underpinned by complex trade-offs.
Figure 3: Income per unit farm area ($/ha/year) and income per unit water ($/ML/year) for a range of whole-farm agronomic and irrigation infrastructure adaptations. The baselinescenario − Current farm system with flood irrigation − is outlined with a darker circle. Adaptations include: Intensified (blue – greater irrigation area, higher nitrogen use, higher irrigation rates, winter and summer crops); Diversified (green – more winter crop types in the rotation, such as legumes); Current (orange – represents the existing farm system,based on a typical farm in the Riverina); and Simplified (purple – reduced irrigation and nitrogen use, mix of dryland and irrigated crops and lower economic risk). Flood, pivot, pipe and riser and drip represent alternative forms of irrigation infrastructure.
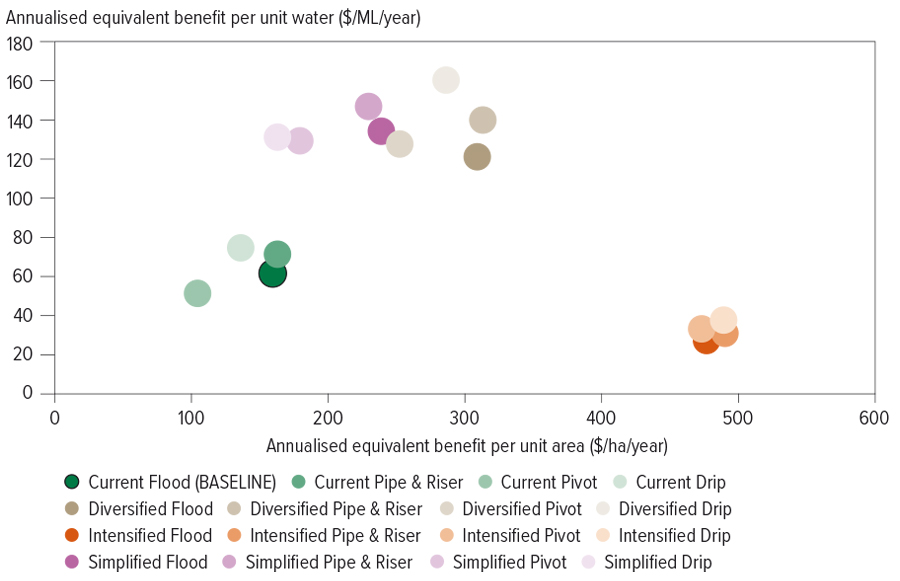
Source: Matthew Harrison
The analytical approach is under peer review. Once published, it will be available to a diverse array of scientists and practitioners to help identify financially feasible irrigation adaptations to increase water productivity, profitability and resilience.
A simplified version of the framework has been incorporated in the freely available Investment App of WaterCan Profit.
More information: Matthew Harrison, matthew.harrison@utas.edu.au; Marta Monjardino, marta.monjardino@csiro.au