


A new mapping tool could help growers trace the signature of frost – soft, white ice crystals and frozen dew drops – in time and space across cropping paddocks.
Frost during or after ear emergence in cereals can cause severe stem and head damage known to reduce crop yield and quality by up to 80 per cent. Overall, frost costs the Australian grains industry an estimated $360 million a year in lost production.
Visual assessment of crop damage five to seven days after a frost event is the only way growers have been able to diagnose frost damage.
However, this could now be superseded by a model-based system that enables growers to map the movement of frost over paddocks on a whole-farm scale.
CSIRO principal research scientist Uday Nidumolu led the development of this novel approach to frost mapping as part of a four-year research project with co-investment from GRDC and CSIRO.
Dr Nidumolu says the tool generates on-farm maps of daily minimum temperatures, which provide an indicator of frost episodes in paddocks. Frost typically happens when the temperature drops below 2°C.
“Mapping overnight minimum temperatures at a farm scale could assist growers to determine if and where crops might be frost-affected,” Dr Nidumolu says, adding that the maps can be rapidly generated on the same day that frost occurs.
“The maps could facilitate more-rapid assessment of crop damage following frost and guide tactical management decisions to help salvage value from frosted crops.”
Dr Nidumolu says the maps are created using a low-cost system that relies on data from two main sources: a single on-farm weather station, and terrain data from Geoscience Australia’s Digital Elevation Model of Australia.
“To generate the paddock maps, growers need to provide three basic measurements from a weather station or temperature logger installed on their property,” he says.
These include the overnight minimum temperature recorded by the weather station, the positional height of the station and its global positioning system coordinates for latitude and longitude.
The modelling tool then combines the station temperature measurements with digital elevation data, which charts the terrain features on growers’ properties since landscape topography is known to influence frost.
The elevation data, derived from the National Aeronautics and Space Administration (NASA) Shuttle Radar Topography Mission, is available for most of the Earth’s surface (56°S to 60°N), including all Australian farms.
Drawing on this detailed terrain data, the modelling tool can map minimum temperatures at a spatial resolution of 30 metres. In other words, the maps could see growers tackle frost management in 30-square-metre paddock zones.
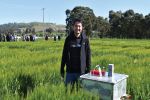
Knowledge lift
Uday Nidumolu explored the findings of the frost modelling research during a field day at Mintaro, South Australia. Photo: David Gobbett, CSIRO
At such high resolution, the maps are expected to complement growers’ site-specific understanding of frost patterns. These complex patterns can vary enormously within paddocks, as well as across properties and localities.
Dr Nidumolu says grower evaluation of the minimum temperature maps highlighted their potential to augment knowledge of frost and, ultimately, improve frost management in cropping systems.
Growers, who hosted mapping trials, sketched frost zones outlining high and low-risk areas on aerial images of their paddocks as part of the research. The hand-drawn maps were then digitised for comparison with the minimum temperature maps generated by the modelling tool.
Dr Nidumolu says the study found there was consensus between growers’ experiential understanding of frost and the temperature maps. This suggests the maps could be used to better target the search for frost damage across large cropping areas. “They can be used as a guide to know where to start looking for frost damage.”
Another benefit of the maps is that they can be used to narrow the search for frosted areas off-site, reducing paddock legwork for growers, he says.
Damage control
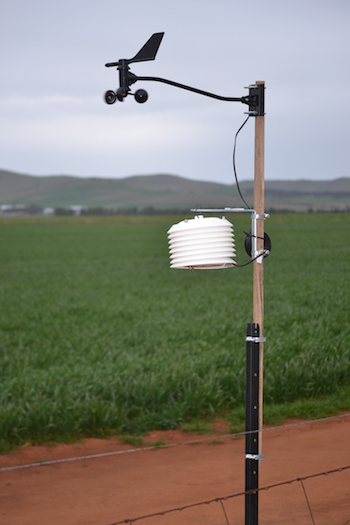 Three basic measurements from one weather station (or temperature logger) are used to generate minimum temperature maps. Photo: David Gobbett, CSIRO
“The modelling tool is part of the solution in the complexity of frost management. It adds to the portfolio of options, both proactive and reactive, that can assist growers to minimise frost impacts on crop yield and quality,” Dr Nidumolu says.
Of these management tactics, he says the main proactive option is cultivar selection, based on crop maturation and optimal sowing dates to promote flowering outside the high-risk frost period. Alternative land uses can also be considered in frequently frosted areas. Reactive options, depending on the extent and severity of frost damage, are cutting grain crops for hay or selective grazing.
“Both proactive and reactive management decisions can benefit from detailed spatial information to help gauge the extent of frost episodes and the risk they might pose in the future,” he says.
In contrast, other temperature data available to growers is mainly sourced from the farm’s nearest Bureau of Meteorology station.
However, this data generally has limited relevance due to the distance from farm to station. And minimum temperatures can only be extrapolated at a relatively coarse scale from station data compared with the 30m2 paddock zones.
Dr Nidumolu says the new tool could be used for strategic farm planning, for instance, exploring enterprise, crop type and cultivar options, and frost-risk assessment to inform decisions on buying or leasing land.
“In the future, the maps could also be combined with a crop phenology model to develop a more powerful tool for estimating frost damage in crops.
“Crop phenology is an important consideration, with frost damage during the reproductive growth stages of spring and winter wheat causing the most serious yield losses.”
The tool could also help optimise the installation of weather stations in paddocks. “The ideal location for a weather station, for example, is characterised by median elevation and terrain variability.”
Paddock trials
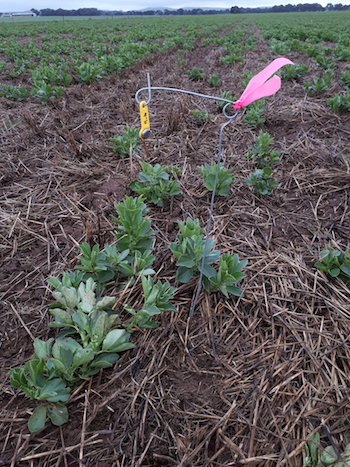 A yellow iButton® logger installed in a faba bean paddock as part of trials at Mintaro, South Australia. Photo: David Gobbett, CSIRO
He says the efficacy of the new system for mapping minimum temperatures was road-tested in a series of paddock trials during 2016, 2017 and 2020.
Preliminary trials in 2016 saw about 90 iButton® loggers installed in each of two 15km2 paddocks at Hopetoun in Victoria and Mintaro in South Australia.
These sites were chosen for trials because they had a history of frost, an elevation range of at least 20m, topography featuring a gully where airflow might converge and the landscape represented the wider cropping region.
Loggers were positioned across the landscape to capture its terrain variability. Temperatures recorded by the loggers at 30-minute intervals were then used to map minimum paddock temperatures for 20 to 25 nights.
“Using the logger data, Multivariate Adaptive Regression Splines (MARS) modelling was able to examine the influence of different terrain variables on minimum temperatures.”
In particular, researchers modelled the anomaly between daily minimum temperature recorded by each logger and an on-site weather station.
Using this approach, researchers developed the model that can predict the minimum temperature at any location in the trial paddock area based on data from one weather station.
Dr Nidumolu says an overall decline in the cost of weather stations, priced at $200 to $300, has made them a cost-effective proposition for growers. But a more basic temperature logger installed in a paddock can also be used to generate the maps. For example, the iButton® loggers used in the trials are about $50 each.
The new system was further tested in South Australia trials during 2017 at Belalie, Jabuk, Mintaro and Spalding, and during 2020 trials at Wickepin and York, Western Australia; Karoonda and Mintaro, SA; and Birchip and Kaniva, Victoria.
Dr Nidumolu says CSIRO and GRDC are exploring options for a pathway to market to facilitate widespread industry adoption of the mapping tool.
More information: Uday Nidumolu, 0417 755 871, uday.nidumolu@csiro.au